UNITED STATES
SECURITIES AND EXCHANGE COMMISSION
WASHINGTON, D.C. 20549
FORM
(Amendment No. 1)
CURRENT REPORT
PURSUANT TO SECTION 13 OR 15(D) OF THE SECURITIES EXCHANGE ACT OF 1934
Date of Report (Date of Earliest Event Reported):
(Exact name of registrant as specified in its charter) |
|
| |||
(State or other jurisdiction of incorporation or organization) |
| (Commission file number) |
| (IRS Employer Identification No.) |
| ||
(Address of principal executive offices) |
| (Zip Code) |
Registrant’s telephone number, including area code: (
Check the appropriate box below if the Form 8-K filing is intended to simultaneously satisfy the filing obligation of the registrant under any of the following provisions (see General Instruction A.2. below):
Written communications pursuant to Rule 425 under the Securities Act (17 CFR 230.425) | |
|
|
Soliciting material pursuant to Rule 14a-12 under the Exchange Act (17 CFR 240.14a-12) | |
|
|
Pre-commencement communications pursuant to Rule 14d-2(b) under the Exchange Act (17 CFR 240.14d-2(b)) | |
|
|
Pre-commencement communications pursuant to Rule 13e-4(c) under the Exchange Act (17 CFR 240.13e-4(c)) |
Securities registered pursuant to Section 12(b) of the Act:
Title of each class | Trading Symbol(s) | Name of each exchange on which registered |
Indicate by check mark whether the registrant is an emerging growth company as defined in Rule 405 of the Securities Act of 1933 (§230.405 of this chapter) or Rule 12b-2 of the Securities Exchange Act of 1934 (§240.12b-2 of this chapter).
Emerging growth company
If an emerging growth company, indicate by check mark if the registrant has elected not to use the extended transition period for complying with any new or revised financial accounting standards provided pursuant to Section 13(a) of the Exchange Act. ☐
EXPLANATION NOTE
PEDEVCO Corp. (the “Company”, “we” and “us”) previously filed a Current Report on Form 8-K with the Securities and Exchange Commission on November 3, 2025 (the “Initial Form 8-K”), disclosing that on October 31, 2025 (the “Closing Date”), the Company entered into, and closed the transactions contemplated by, an Agreement and Plan of Merger (the “Merger Agreement”), with NP Merger Sub, LLC, a Delaware limited liability company and wholly-owned subsidiary of the Company (“First Merger Sub”), COG Merger Sub, LLC, a Delaware limited liability company and wholly-owned subsidiary of the Company (“Second Merger Sub,” and together with First Merger Sub, the “Merger Subs”), North Peak Oil & Gas, LLC, a Delaware limited liability company (“NPOG”), Century Oil and Gas Sub-Holdings, LLC, a Delaware limited liability company (“COG,” and together with NPOG, “North Peak”), and, solely for purposes of the specified provisions therein, North Peak Oil & Gas Holdings, LLC, a Delaware limited partnership (“North Peak Holdings”), pursuant to which (a) First Merger Sub merged with and into NPOG, with NPOG being the surviving entity and a wholly-owned subsidiary of PEDEVCO, and (b) Second Merger Sub merged with and into COG, with COG being the surviving entity and a wholly owned subsidiary of PEDEVCO (clauses (a) and (b), together, the “Mergers” or the “North Peak Merger”). Concurrently with the closing of the Mergers, certain investors subscribed for and purchased an aggregate of 6,363,637 shares of PEDEVCO Series A Preferred Stock at a price per share equal to $5.50 per share or an aggregate of $35,000,004, from the Company. North Peak owns substantial oil-weighted producing assets and leasehold interests with future drilling inventory located in the Northern DJ and Powder River Basins including approximately 281,000 net acres.
At the time of the filing of the Initial Form 8-K, the Company stated that it intended to file the required financial statements and pro forma financial information associated with the Mergers within 71 days from the date that such Initial Form 8-K was required to be filed. By this Amendment No. 1 to the Initial Form 8-K, the Company is amending and restating Item 9.01 thereof to include the required financial statements and pro forma financial information, which are filed as exhibits hereto and are incorporated herein by reference.
Except for this Explanatory Note, the filing of the financial statements and the pro forma financial information required by Item 9.01, and the consent of Whitley Penn LLP, filed herewith as Exhibit 23.1, there are no changes to the Closing Form 8-K.
Item 9.01. Financial Statements and Exhibits.
(a) | Financial Statements of Business Acquired. |
(i) North Peak’s audited financial statements, comprising the combined balance sheets as of December 31, 2024 and 2023, and the related combined statements of operations, combined statements of changes in members’ equity, and combined statements of cash flows for each of the years then ended, and the related notes to the financial statements, are filed as Exhibit 99.1 to this Current Report on Form 8-K/A and are incorporated herein by reference.
(ii) North Peak’s unaudited financial statements, comprising the condensed combined consolidated balance sheets as of September 30, 2025 and December 31, 2024, and the related condensed combined consolidated statements of operations, condensed combined statements of changes in members’ equity, and condensed combined statements of cash flows for each of the nine months ended September 30, 2025 and 2024, and the related notes to the financial statements, are filed as Exhibit 99.2 to this Current Report on Form 8-K/A and are incorporated herein by reference.
| 2 |
(b) | Pro forma financial information. |
The unaudited pro forma financial information required by Item 9.01, as well as the accompanying notes thereto, are filed as Exhibit 99.3 to this Current Report on Form 8-K/A and are incorporated herein by reference. The unaudited pro forma combined financial statements are based on the historical consolidated financial statements of the Company and adjusts such information to give effect of the Mergers.
The unaudited pro forma condensed combined balance sheet data as of September 30, 2025, gives effect to the North Peak Merger as if it had occurred on September 30, 2025. The unaudited pro forma condensed combined statement of operations for the nine-month period ended September 30, 2025, gives pro forma effect to the North Peak Merger as if it had occurred on January 1, 2024. The unaudited pro forma condensed combined statement of operations for the twelve-month period ended December 31, 2024, gives pro forma effect to the North Peak Merger as if it had occurred on January 1, 2024.
The unaudited pro forma condensed combined financial information is provided for illustrative purposes only and does not purport to represent what the actual consolidated results of operations of PEDEVCO would have been had the North Peak Merger occurred on the date noted above, nor are they necessarily indicative of future consolidated results of operations.
(d) Exhibits.
Exhibit Number |
| Description of Exhibit |
| ||
| ||
| ||
| ||
104 |
| Cover Page Interactive Data File (embedded within the Inline XBRL document) |
* Filed herewith
| 3 |
CAUTIONARY NOTE REGARDING FORWARD-LOOKING STATEMENTS
This Current Report on Form 8-K/A and Exhibits 99.1, 99.2, and 99.3 hereto contain forward-looking statements within the safe harbor provisions under the federal securities laws, including The Private Securities Litigation Reform Act of 1995, and, as such, may involve known and unknown risks, uncertainties and assumptions. These forward-looking statements relate to the Company’s current expectations and are subject to the limitations and qualifications set forth in the press release as well as in the Company’s other filings with the Securities and Exchange Commission, including, without limitation, that actual events and/or results may differ materially from those projected in such forward-looking statements. These statements also involve known and unknown risks, which may cause the results of the Company and its subsidiaries to be materially different than those expressed or implied in such statements. Accordingly, readers should not place undue reliance on any forward-looking statements. Forward-looking statements may include comments as to the Company’s beliefs and expectations as to future financial performance, events and trends affecting its business and are necessarily subject to uncertainties, many of which are outside the Company’s control. More information on potential factors that could affect the Company’s financial results is included from time to time in the “Cautionary Note Regarding Forward-Looking Statements,” “Risk Factors” and “Management’s Discussion and Analysis of Financial Condition and Results of Operations” sections of the Company’s periodic and current filings with the SEC, including the Form 10-Qs and Form 10-Ks, filed with the SEC and available at www.sec.gov and the Company’s website at https://www.PEDEVCO.com/ped/sec_filings, and specifically including the Company’s Annual Report on Form 10-K/A for the year ended December 31, 2024 and the Company’s Quarterly Report on Form 10-Q for the quarter ended September 30, 2025. Forward-looking statements speak only as of the date they are made. The Company undertakes no obligation to publicly update or revise any forward-looking statements, whether as a result of new information, future events or otherwise that occur after that date, except as otherwise provided by law.
| 4 |
SIGNATURES
Pursuant to the requirements of the Securities Exchange Act of 1934, the registrant has duly caused this report to be signed on its behalf by the undersigned hereunto duly authorized.
| PEDEVCO CORP. |
| |
|
|
| |
Date: December 23, 2025 | By: | /s/ J. Douglas Schick | |
|
| J. Douglas Schick | |
|
| President and Chief Executive Officer | |
| 5 |
EXHIBIT 23.1
CONSENT OF INDEPENDENT REGISTERED PUBLIC ACCOUNTING FIRM
We consent to the inclusion in this Current Report on Form 8-K/A (Amendment 1) of PEDEVCO Corp., of our report dated June 2, 2025, relating to the audit of the combined financial statements of North Peak Oil and Gas as of December 31, 2024 and 2023 and for the years then ended.
/s/ Whitley Penn LLP
Houston, Texas
December 23, 2025
EXHIBIT 99.1

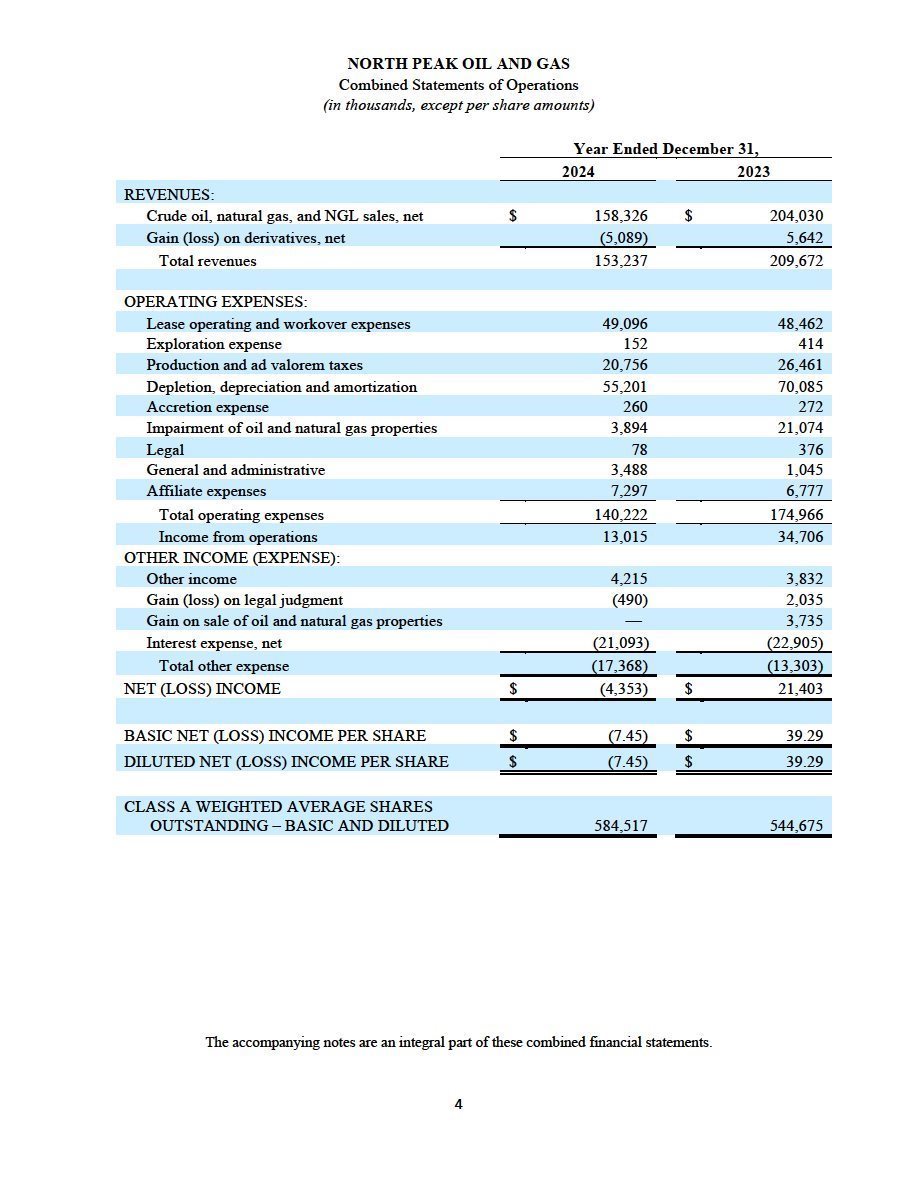
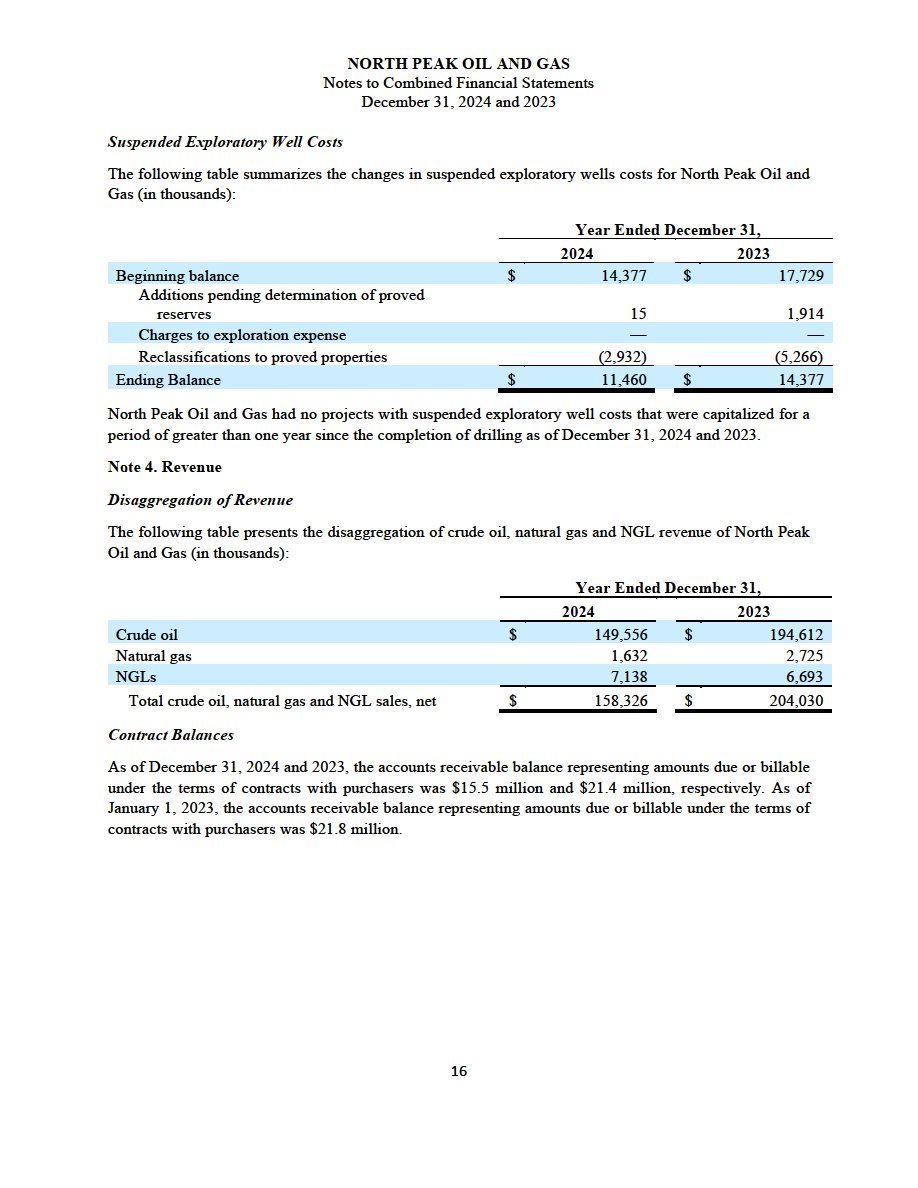
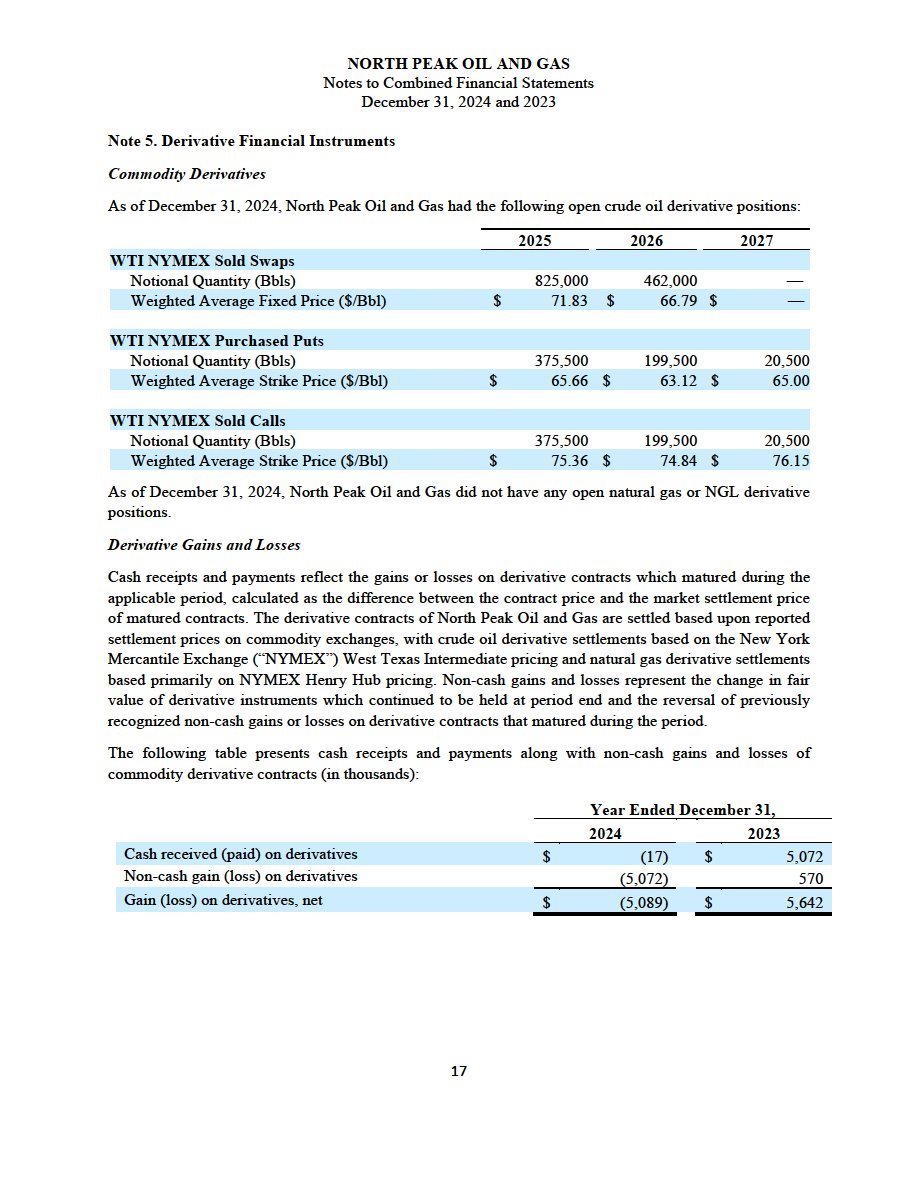
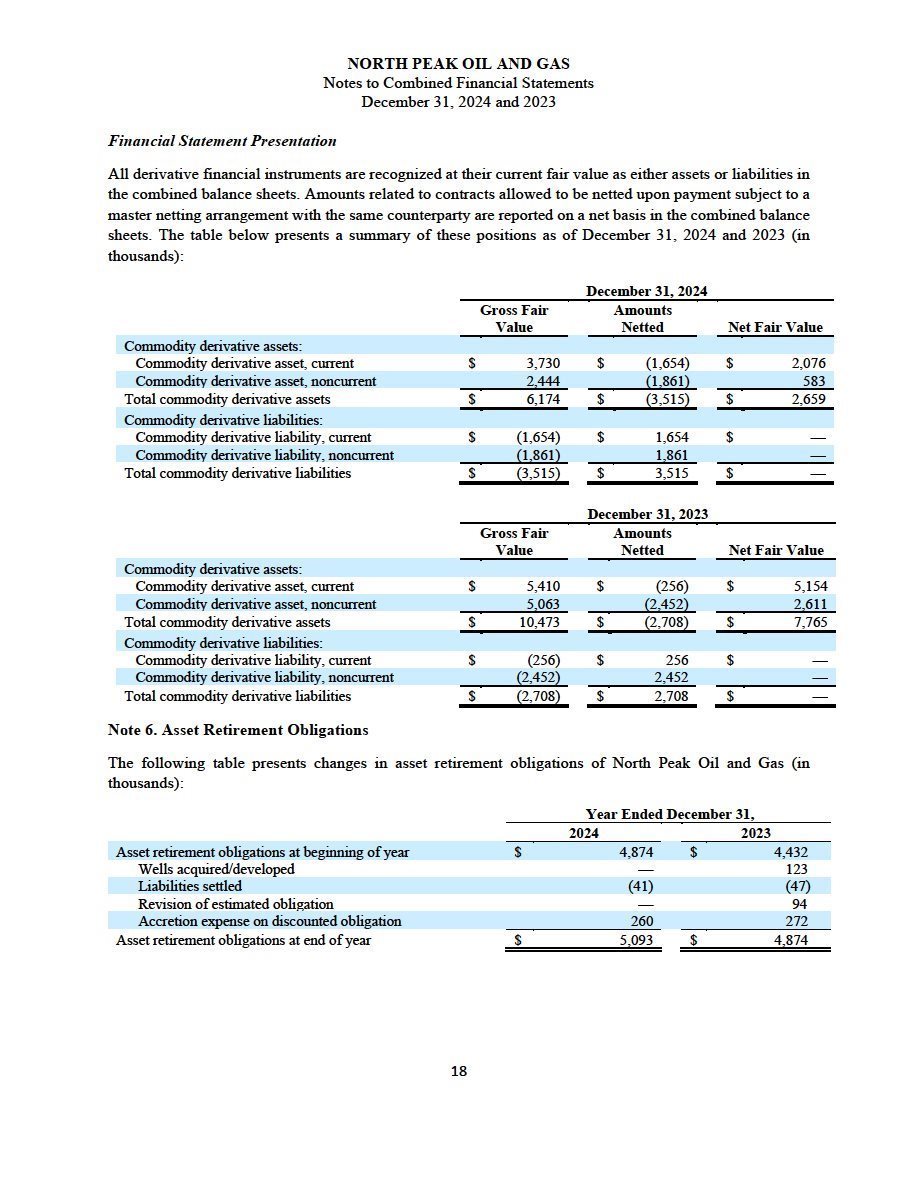
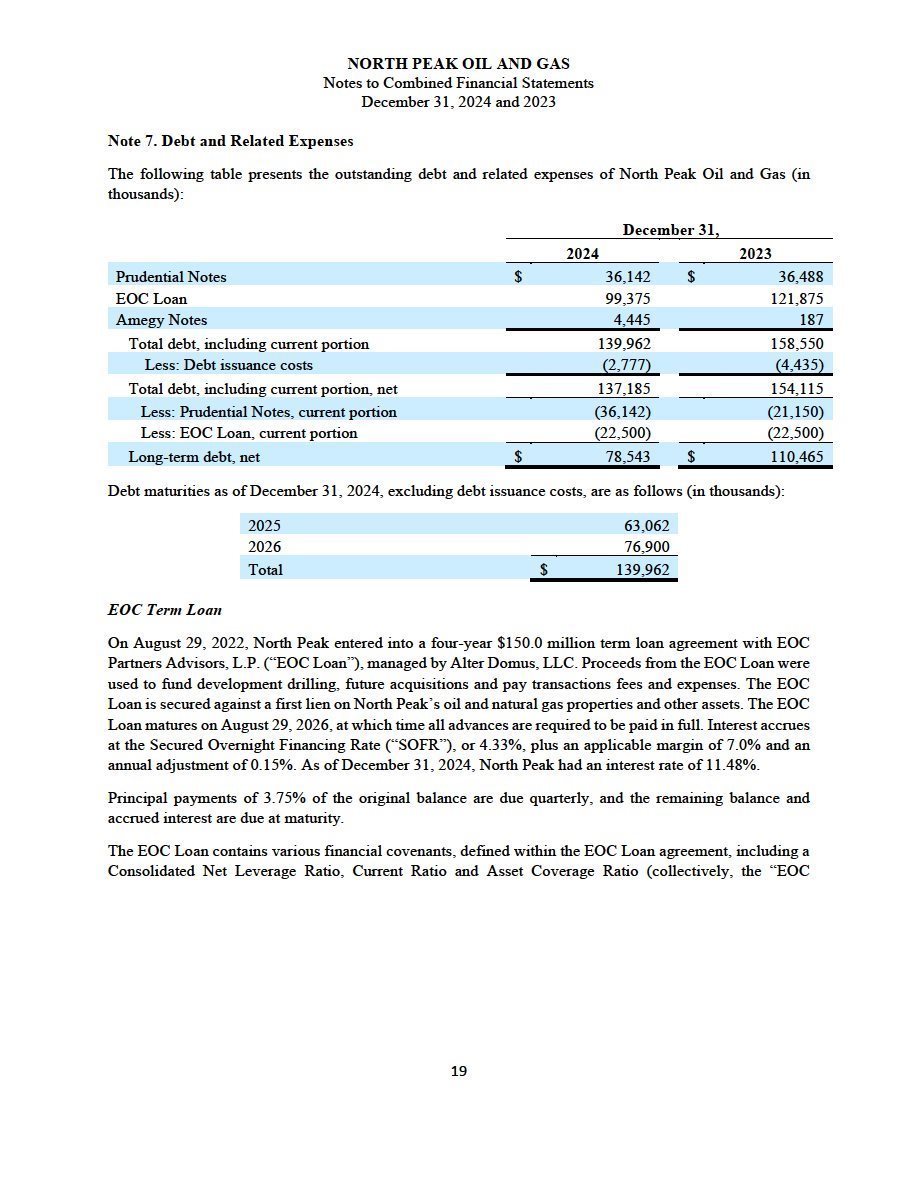
EXHIBIT 99.2
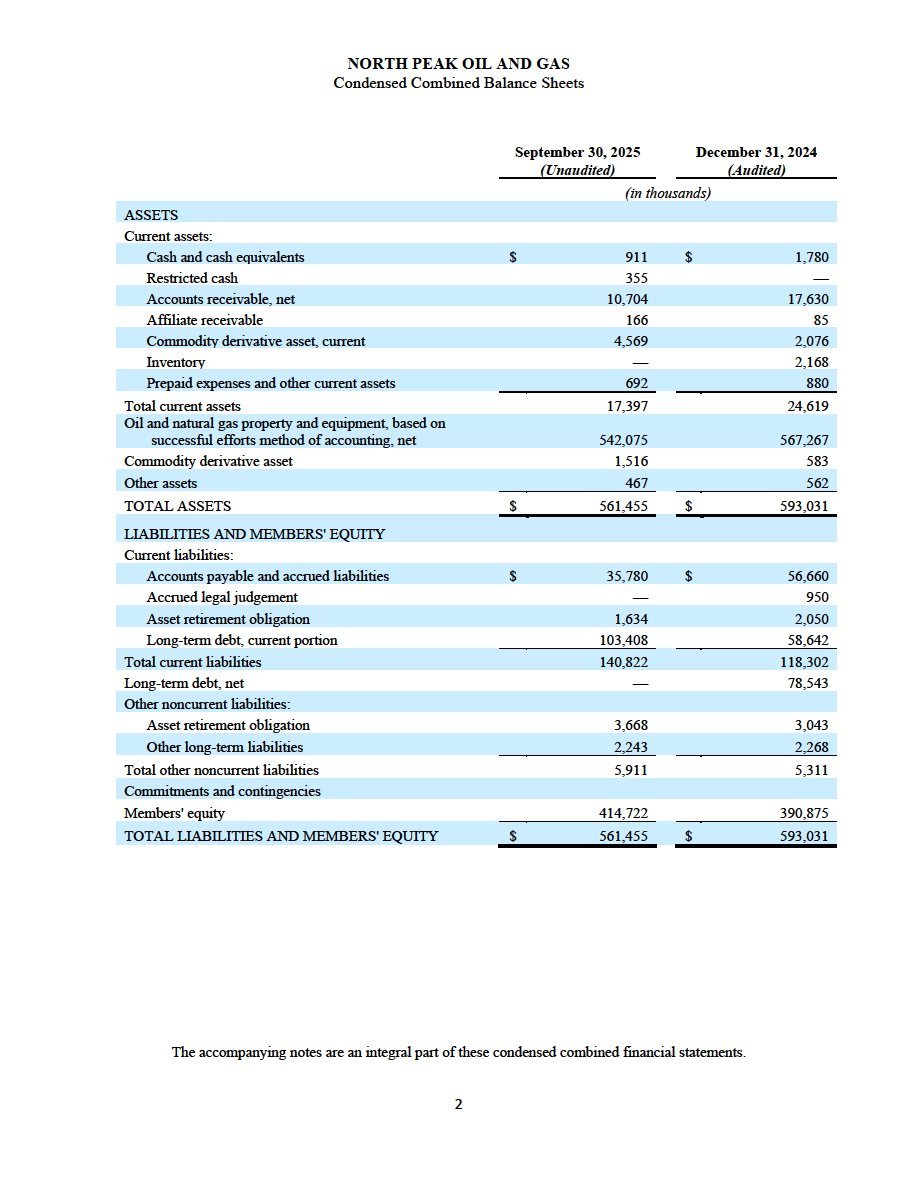
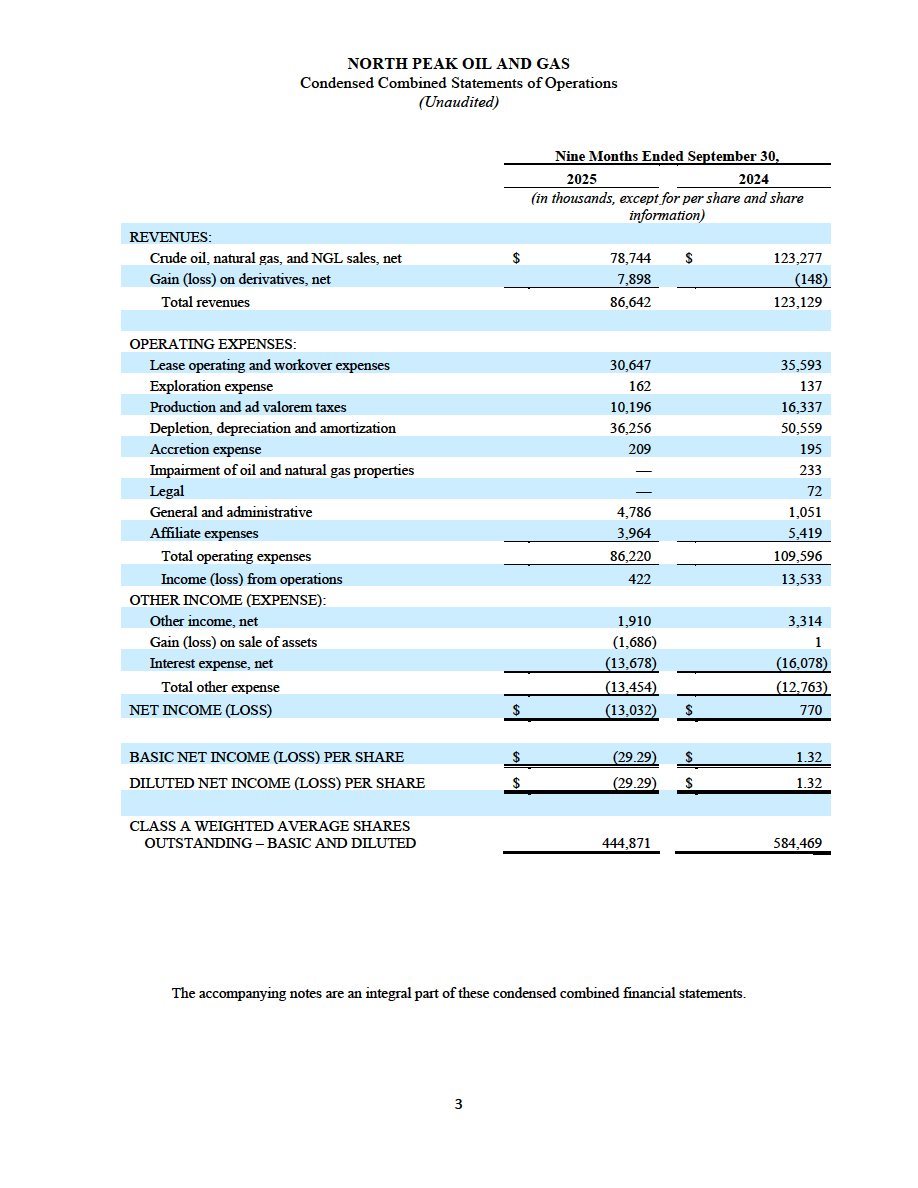
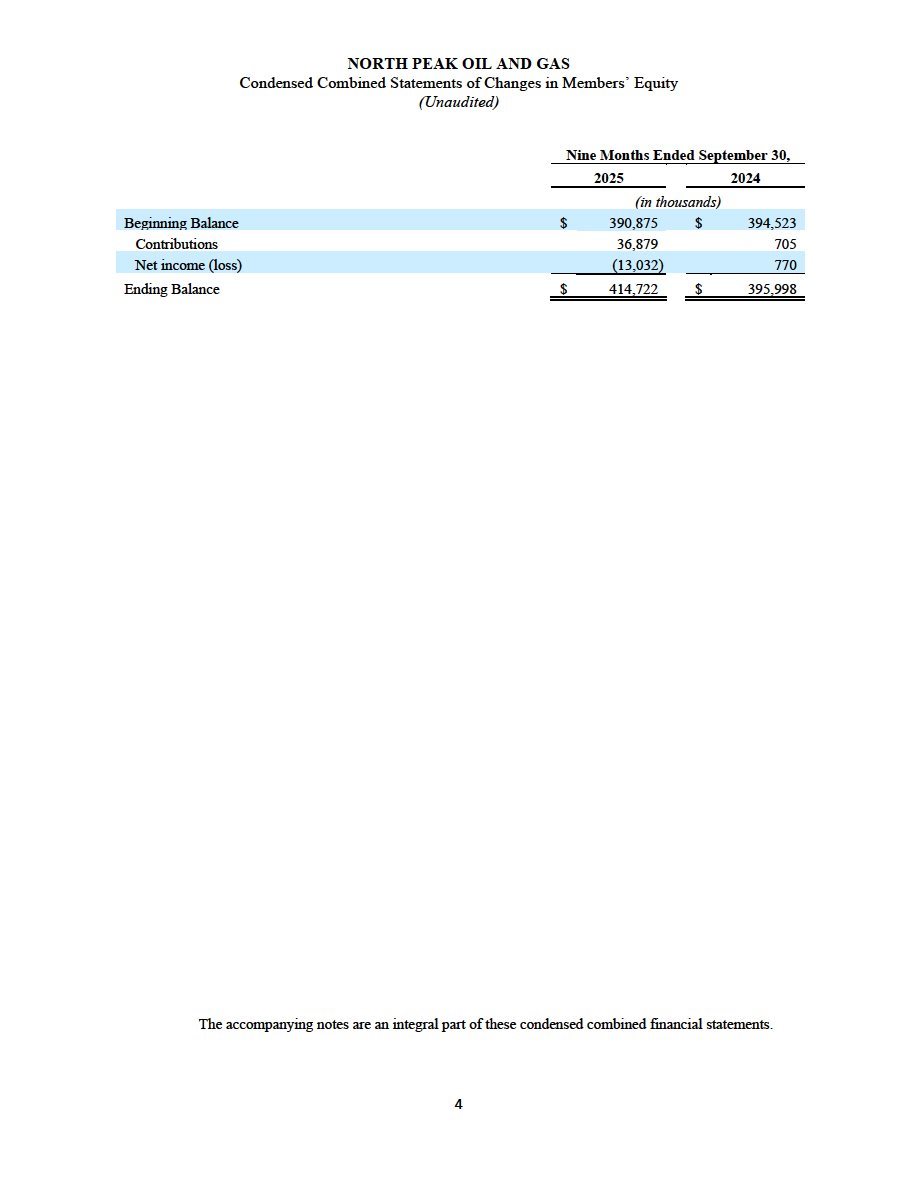
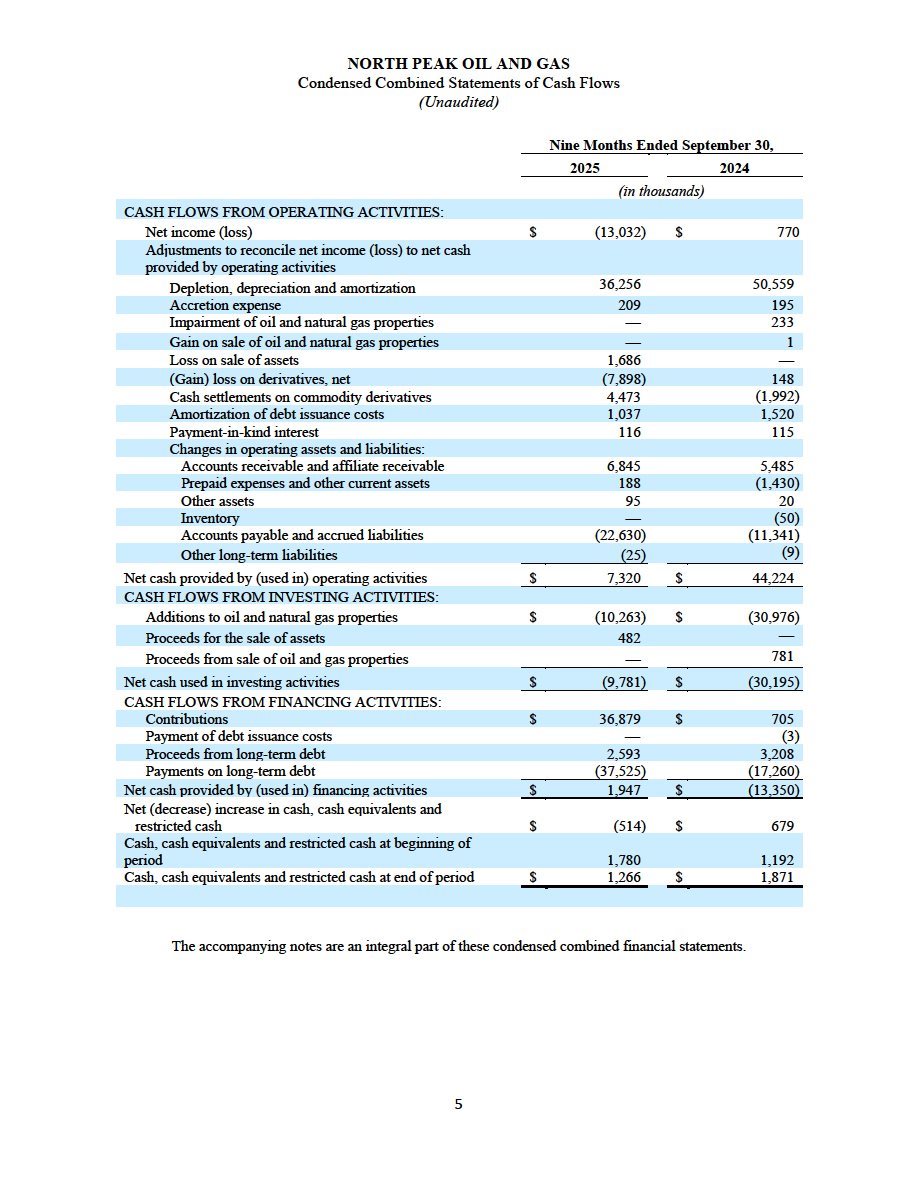
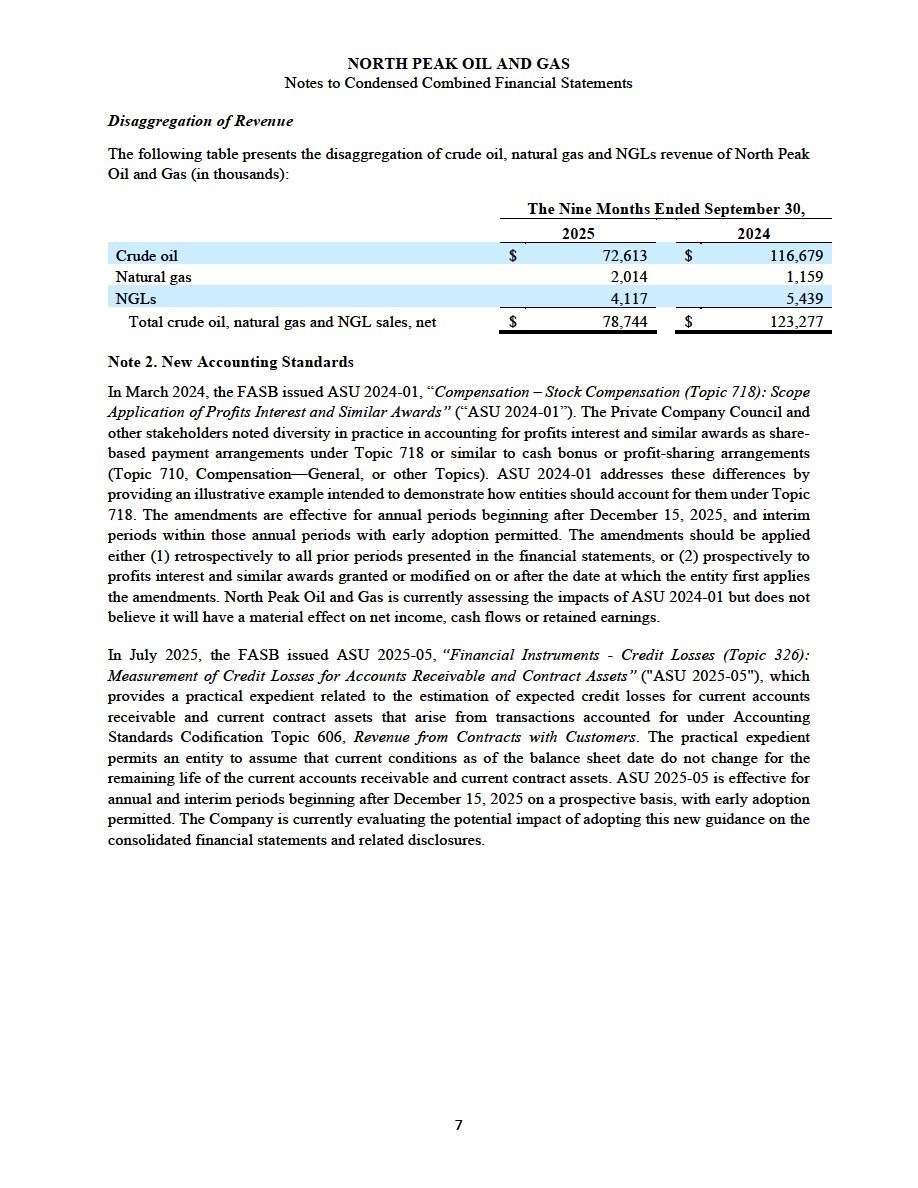
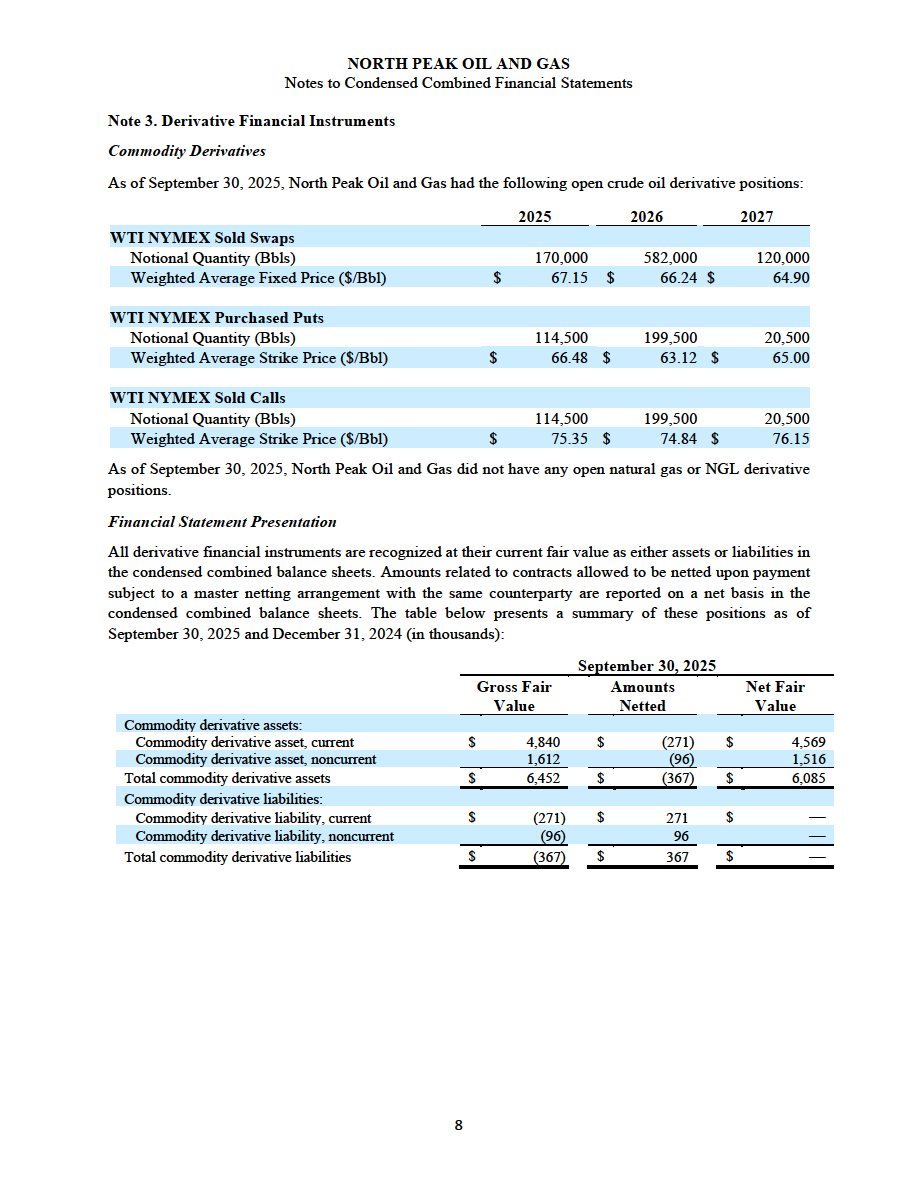
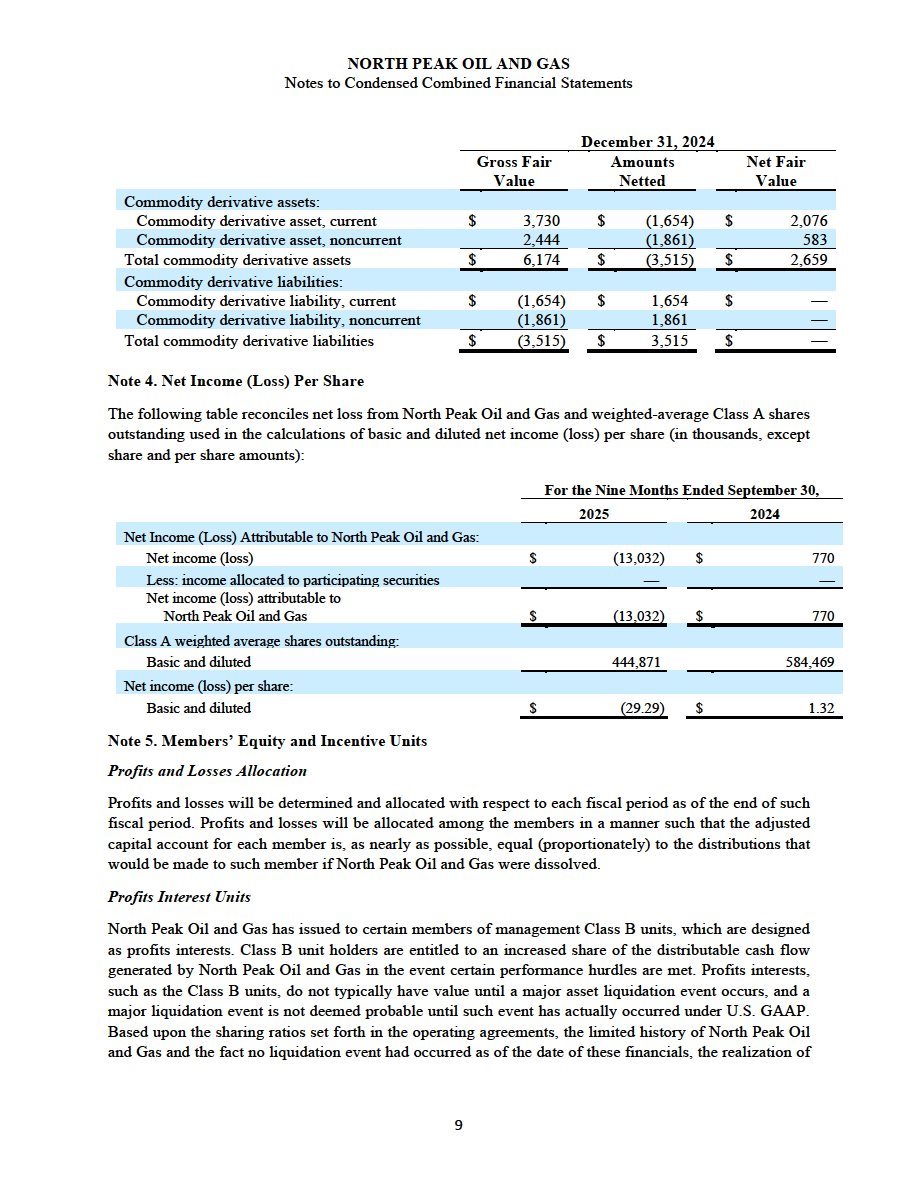
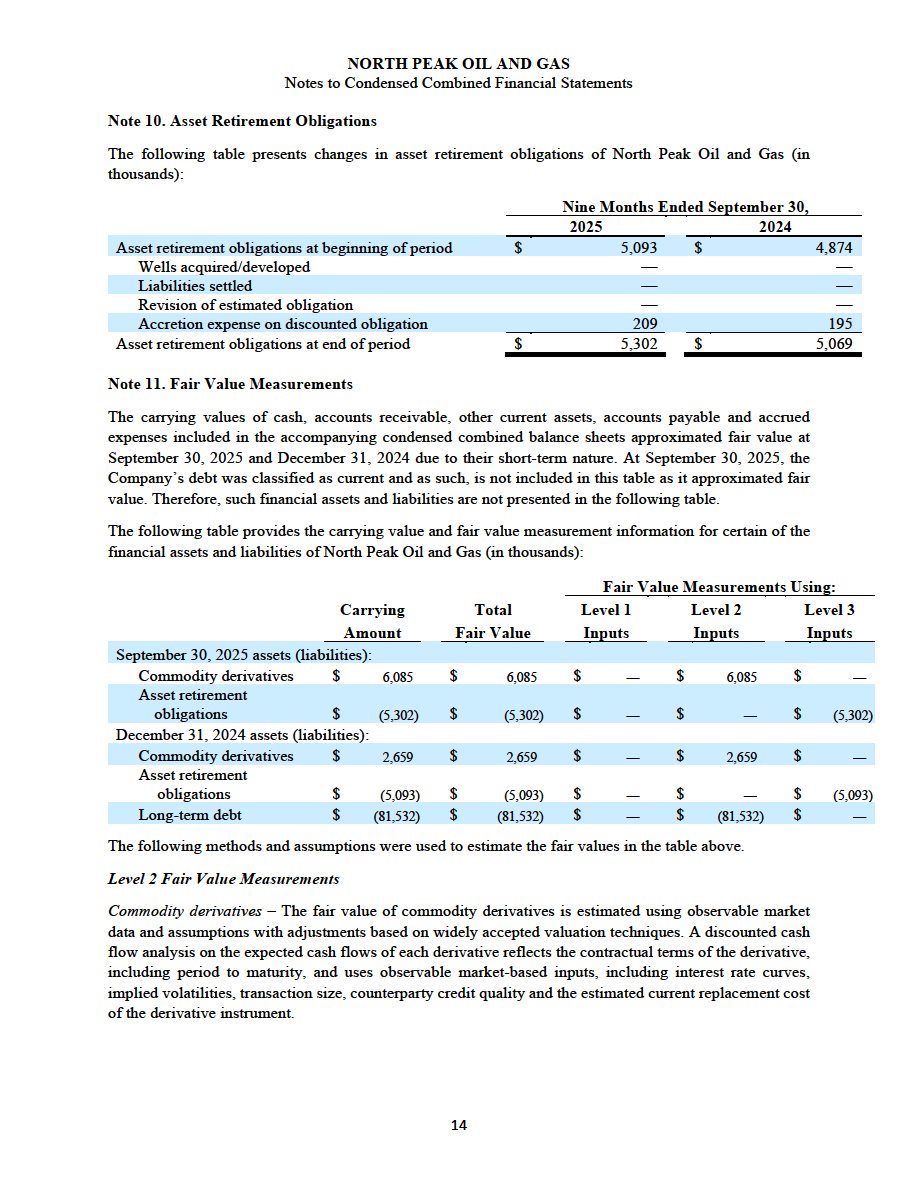
EXHIBIT 99.3
PEDEVCO Corp.
Unaudited Pro Forma Condensed Combined Financial Information
On October 31, 2025 (the “Closing Date”), PEDEVCO Corp., a Texas corporation (the “Company” or “PEDEVCO”), entered into an Agreement and Plan of Merger (the “Merger Agreement”), with NP Merger Sub, LLC, a Delaware limited liability company and wholly owned subsidiary of the Company (“First Merger Sub”), COG Merger Sub, LLC, a Delaware limited liability company and wholly owned subsidiary of the Company (“Second Merger Sub,” and together with First Merger Sub, the “Merger Subs”), North Peak Oil & Gas, LLC, a Delaware limited liability company (“NPOG”), Century Oil and Gas Sub-Holdings, LLC, a Delaware limited liability company (“COG,” and together with NPOG, “North Peak”), and, solely for purposes of the specified provisions therein, North Peak Oil & Gas Holdings, LLC, a Delaware limited partnership (“North Peak Holdings”).
Pursuant to the Merger Agreement, at the effective time, (a) First Merger Sub merged with and into NPOG, with NPOG being the surviving entity and a wholly owned subsidiary of PEDEVCO and (b) Second Merger Sub merged with and into COG, with COG being the surviving entity and a wholly owned subsidiary of PEDEVCO (clauses (a) and (b), together, the “Mergers”). North Peak owns substantial oil-weighted producing assets and leasehold interests with future drilling inventory located in the Northern DJ and Powder River Basins including approximately 281,000 net acres (“North Peak Merger”). The North Peak Merger closed on October 31, 2025.
Concurrently with the Closing Date of the North Peak Merger, certain investors subscribed for and purchased an aggregate of 6,363,637 shares of PEDEVCO Series A Preferred Stock (the “PIPE Preferred Shares”), at a price per share equal to $5.50 per share, for net proceeds of $35.0 million, pursuant to these investors entering into Series A Convertible Preferred Stock Subscription Agreements in favor of PEDEVCO. The PIPE Preferred Shares automatically convert at a ratio of 10-to-1 into PEDEVCO common stock immediately following a 20-calendar day waiting period, which commences on the distribution of PEDEVCO’s information statement. When converted in full, the PIPE Preferred Shares will convert into 63,636,370 shares of PEDEVCO common stock.
Based on estimates as of October 31, 2025, the fair value of consideration paid to the seller, after closing adjustments, is approximately $179.9 million, including 10,650,000 of Series A Convertible Preferred Stock, with a fair value of $64.2 million and convertible into 106,500,000 shares of PEDEVCO common stock along with $115.7 million in cash paid to settle North Peak’s debt, a portion of which was funded by the net proceeds received from the PIPE Preferred Shares with the remainder funded by PEDEVCO’s revolving credit facility. Additionally, as part of the North Peak Merger, PEDEVCO acquired all assets and liabilities of North Peak.
The North Peak Merger will be accounted for as a business combination in accordance with Accounting Standards Codification Topic 805, Business Combinations (“ASC 805”). PEDEVCO will be treated as the accounting acquirer and therefore, will recognize the assets acquired and liabilities assumed at their respective fair values as of the closing date. Any transaction costs will be expensed as incurred in accordance with ASC 805. The unaudited pro forma condensed combined financial information presented herein has been prepared to reflect the transaction accounting adjustments to PEDEVCO’s historical consolidated financial information in order to account for the North Peak Merger and include the assumption of liabilities as set forth in the Merger Agreement.
The Unaudited Pro Forma Condensed Combined Balance Sheet as of September 30, 2025 gives effect to the North Peak Merger as if it had been completed on September 30, 2025. The Unaudited Pro Forma Condensed Combined Statements of Operations for the nine months ended September 30, 2025 and the year ended December 31, 2024 gives effect to the North Peak Merger as if it had been completed on January 1, 2024. The unaudited pro forma condensed combined financial information has been compiled in a manner consistent with the accounting policies adopted by PEDEVCO. These pro forma adjustments are described in more detail in the accompanying notes to the unaudited pro forma condensed combined financial information. Additional assumptions and estimates underlying the pro forma adjustments are also described in the accompanying notes, which should be read in conjunction with the unaudited pro forma condensed combined financial information.
The unaudited pro forma condensed combined financial information is provided for illustrative purposes only and does not purport to represent what the actual consolidated results of operations of PEDEVCO would have been had the North Peak Merger occurred on the date noted above, nor are they necessarily indicative of future consolidated results of operations. Future results may vary significantly from the results reflected because of various factors. In PEDEVCO’s opinion, all adjustments that are necessary to present fairly the unaudited pro forma condensed combined financial information have been made.
The unaudited pro forma condensed combined financial information does not reflect the benefits of potential cost savings or the costs that may be necessary to achieve such savings, opportunities to increase revenue generation or other factors that may result from the North Peak Merger and, accordingly, does not attempt to predict or suggest future results.
The unaudited pro forma condensed combined financial information has been developed from and should be read in conjunction with:
|
| · | The audited consolidated financial statements and accompanying notes of PEDEVCO contained in PEDEVCO’s Annual Report on Form 10-K/A for the year ended December 31, 2024 filed with the SEC on October 31, 2025; |
|
|
|
|
|
| · | The unaudited consolidated financial statements and accompanying notes of PEDEVCO contained in PEDEVCO’s Quarterly Report on Form 10-Q for the quarter ended September 30, 2025 filed with the SEC on November 14, 2025; |
|
|
|
|
|
| · | The audited combined financial statements and accompanying notes of North Peak as of and for the year ended December 31, 2024, which are included elsewhere in this filing; and |
|
|
|
|
|
| · | The unaudited combined financial statements and accompanying notes of North Peak as of September 30, 2025 and for the nine months ended September 30, 2025, which are included elsewhere in this filing. |
| PEDEVCO Corp. | ||||||||||||||||||||||||
| Unaudited Pro Forma Condensed Combined Balance Sheet | ||||||||||||||||||||||||
| As of September 30, 2025 | ||||||||||||||||||||||||
| (amounts in thousands, except for per share amounts) | ||||||||||||||||||||||||
|
|
|
|
|
|
|
|
|
|
|
|
|
|
| |||||||||||
|
|
|
|
|
| Transaction Accounting Adjustments |
|
|
|
|
|
| |||||||||||||
|
|
| Historical |
|
| Conforming and |
|
|
| North Peak |
|
|
|
| Pro Forma |
| |||||||||
|
|
| PEDEVCO |
|
| North Peak |
|
| Reclassifications |
|
|
| Merger |
|
|
| Combined |
| |||||||
| Assets |
|
|
|
|
|
|
|
|
|
|
|
|
|
|
|
|
|
|
| |||||
| Current assets: |
|
|
|
|
|
|
|
|
|
|
|
|
|
|
|
|
|
|
| |||||
| Cash and cash equivalents |
| $ | 10,922 |
|
| $ | 911 |
|
| $ | 355 |
|
| (a) |
| $ | 35,000 |
|
| (c) |
| $ | 12,492 |
|
|
|
|
|
|
|
|
|
|
|
|
|
|
|
|
|
|
| 87,000 |
|
| (h) |
|
|
|
|
|
|
|
|
|
|
|
|
|
|
|
|
|
|
|
|
|
| (115,646 | ) |
| (i) |
|
|
|
|
|
|
|
|
|
|
|
|
|
|
|
|
|
|
|
|
|
| (1,335 | ) |
| (h) |
|
|
|
|
|
|
|
|
|
|
|
|
|
|
|
|
|
|
|
|
|
| (4,715 | ) |
| (j) |
|
|
|
|
| Restricted cash |
|
| — |
|
|
| 355 |
|
|
| (355 | ) |
| (a) |
|
| — |
|
|
|
|
| — |
|
| Account receivable – oil and gas |
|
| 5,002 |
|
|
| — |
|
|
| 10,870 |
|
| (a) |
|
| — |
|
|
|
|
| 15,872 |
|
| Accounts receivable, net |
|
| — |
|
|
| 10,704 |
|
|
| (10,704 | ) |
| (a) |
|
| — |
|
|
|
|
| — |
|
| Affiliate receivable |
|
| — |
|
|
| 166 |
|
|
| (166 | ) |
| (a) |
|
| — |
|
|
|
|
| — |
|
| Commodity derivative asset |
|
| — |
|
|
| 4,569 |
|
|
| — |
|
|
|
|
| — |
|
|
|
|
| 4,569 |
|
| Prepaid expenses and other current assets |
|
| 229 |
|
|
| 692 |
|
|
| — |
|
|
|
|
| — |
|
|
|
|
| 921 |
|
| Total current assets |
|
| 16,153 |
|
|
| 17,397 |
|
|
| — |
|
|
|
|
| 304 |
|
|
|
|
| 33,854 |
|
|
|
|
|
|
|
|
|
|
|
|
|
|
|
|
|
|
|
|
|
|
|
|
|
|
|
| Oil and gas properties: |
|
|
|
|
|
|
|
|
|
|
|
|
|
|
|
|
|
|
|
|
|
|
|
|
| Oil and gas properties, subject to amortization, net |
|
| 93,431 |
|
|
| — |
|
|
| — |
|
|
|
|
| 190,116 |
|
| (d) |
|
| 285,131 |
|
|
|
|
|
|
|
|
|
|
|
|
|
|
|
|
|
|
| 1,584 |
|
| (f) |
|
|
|
|
| Oil and natural gas property and equipment, based on successful efforts method of accounting, net |
|
| — |
|
|
| 542,075 |
|
|
| — |
|
|
|
|
| (542,075 | ) |
| (b) |
|
| — |
|
| Oil and gas properties, not subject to amortization, net |
|
| 14,400 |
|
|
| — |
|
|
| — |
|
|
|
|
| 8,393 |
|
| (e) |
|
| 22,793 |
|
| Total oil and gas properties, net |
|
| 107,831 |
|
|
| 542,075 |
|
|
| — |
|
|
|
|
| (341,982 | ) |
|
|
|
| 307,924 |
|
|
|
|
|
|
|
|
|
|
|
|
|
|
|
|
|
|
|
|
|
|
|
|
|
|
|
| Operating lease – right-of-use asset |
|
| 256 |
|
|
| — |
|
|
| — |
|
|
|
|
| — |
|
|
|
|
| 256 |
|
| Commodity derivative asset |
|
| — |
|
|
| 1,516 |
|
|
| — |
|
|
|
|
| — |
|
|
|
|
| 1,516 |
|
| Deferred income taxes |
|
| 7,833 |
|
|
| — |
|
|
| — |
|
|
|
|
| 990 |
|
| (k) |
|
| 8,823 |
|
| Other assets |
|
| 3,815 |
|
|
| 467 |
|
|
| — |
|
|
|
|
| 1,335 |
|
| (h) |
|
| 5,617 |
|
| Total assets |
| $ | 135,888 |
|
| $ | 561,455 |
|
| $ | — |
|
|
|
| $ | (339,353 | ) |
|
|
| $ | 357,990 |
|
| Liabilities and Shareholders’ Equity |
|
|
|
|
|
|
|
|
|
|
|
|
|
|
|
|
|
|
|
|
|
|
|
|
|
|
|
|
|
|
|
|
|
|
|
|
|
|
|
|
|
|
|
|
|
|
|
|
|
|
| Current liabilities: |
|
|
|
|
|
|
|
|
|
|
|
|
|
|
|
|
|
|
|
|
|
|
|
|
| Accounts payable |
| $ | 10,295 |
|
| $ | — |
|
| $ | 17,268 |
|
| (a) |
| $ | — |
|
|
|
| $ | 27,563 |
|
| Accrued expenses |
|
| 1,339 |
|
|
|
|
|
|
| 3,185 |
|
| (a) |
|
| — |
|
|
|
|
| 4,524 |
|
| Accounts payable and accrued liabilities |
|
| — |
|
|
| 35,780 |
|
|
| (35,780 | ) |
| (a) |
|
| — |
|
|
|
|
| — |
|
| Revenue payable |
|
| 2,208 |
|
|
| — |
|
|
| 15,327 |
|
| (a) |
|
| — |
|
|
|
|
| 17,535 |
|
| Operating lease liabilities – current |
|
| 178 |
|
|
| — |
|
|
| — |
|
|
|
|
| — |
|
|
|
|
| 178 |
|
| Asset retirement obligations |
|
| 616 |
|
|
| 1,634 |
|
|
| — |
|
|
|
|
| (1,146 | ) |
| (f) |
|
| 1,104 |
|
| Long-term debt, current portion |
|
| — |
|
|
| 103,408 |
|
|
| — |
|
|
|
|
| (115,646 | ) |
| (i) |
|
| — |
|
|
|
|
|
|
|
|
|
|
|
|
|
|
|
|
|
|
| 12,238 |
|
| (l) |
|
|
|
|
| Total current liabilities |
|
| 14,636 |
|
|
| 140,822 |
|
|
| — |
|
|
|
|
| (104,554 | ) |
|
|
|
| 50,904 |
|
| Long-term liabilities: |
|
|
|
|
|
|
|
|
|
|
|
|
|
|
|
|
| |||||||
| Long-term debt |
|
| — |
|
|
|
|
|
| — |
|
|
|
|
| 87,000 |
|
| (h) |
|
| 87,000 |
| |
| Operating lease liabilities, net of current portion |
|
| 79 |
|
|
| — |
|
|
| — |
|
|
|
|
| — |
|
|
|
|
| 79 |
|
| Asset retirement obligations, net of current portion |
|
| 5,805 |
|
|
| 3,668 |
|
|
| — |
|
|
|
|
| (2,572 | ) |
| (f) |
|
| 6,901 |
|
| Other long-term liabilities |
|
| — |
|
|
| 2,243 |
|
|
| — |
|
|
|
|
| — |
|
|
|
|
| 2,243 |
|
| Total liabilities |
|
| 20,520 |
|
|
| 146,733 |
|
|
| — |
|
|
|
|
| (20,126 | ) |
|
|
|
| 147,127 |
|
|
|
|
|
|
|
|
|
|
|
|
|
|
|
|
|
|
|
|
|
|
|
|
|
|
|
| Commitments and contingencies |
|
|
|
|
|
|
|
|
|
|
|
|
|
|
|
|
|
|
|
|
|
|
|
|
|
|
|
|
|
|
|
|
|
|
|
|
|
|
|
|
|
|
|
|
|
|
|
|
|
|
| Shareholders’ equity: |
|
|
|
|
|
|
|
|
|
|
|
|
|
|
|
|
|
|
|
|
|
|
|
|
| Common stock, $0.001 par value |
|
| 93 |
|
|
| — |
|
|
| — |
|
|
|
|
| — |
|
|
|
|
| 93 |
|
| Additional paid-in capital |
|
| 228,634 |
|
|
| — |
|
|
| — |
|
|
|
|
| — |
|
|
|
|
| 228,634 |
|
| Convertible preferred stock |
|
| — |
|
|
| — |
|
|
| — |
|
|
|
|
| 64,220 |
|
| (g) |
|
| 99,220 |
|
|
|
|
|
|
|
|
|
|
|
|
|
|
|
|
|
|
| 35,000 |
|
| (c) |
|
|
|
|
| Members’ equity |
|
| — |
|
|
| 414,722 |
|
|
| — |
|
|
|
|
| (414,722 | ) |
| (b) |
|
| — |
|
| Accumulated deficit |
|
| (113,359 | ) |
|
| — |
|
|
| — |
|
|
|
|
| (4,715 | ) |
| (j) |
|
| (117,084 | ) |
|
|
|
|
|
|
|
|
|
|
|
|
|
|
|
|
|
| 990 |
|
| (k) |
|
|
|
|
| Total shareholders’ equity |
|
| 115,368 |
|
|
| 414,722 |
|
|
| — |
|
|
|
|
| (319,227 | ) |
|
|
|
| 210,863 |
|
| Total liabilities and shareholders’ equity |
| $ | 135,888 |
|
| $ | 561,455 |
|
| $ | — |
|
|
|
| $ | (339,353 | ) |
|
|
| $ | 357,990 |
|
The accompanying notes are an integral part of these unaudited pro forma condensed combined financial statements.
| PEDEVCO Corp. | ||||||||||||||||||||||||
| Unaudited Pro Forma Condensed Combined Statement of Operations | ||||||||||||||||||||||||
| For the Nine Months Ended September 30, 2025 | ||||||||||||||||||||||||
| (amounts in thousands, except for share and per share amounts) | ||||||||||||||||||||||||
|
|
|
|
|
|
|
|
|
|
|
|
|
|
|
|
|
|
|
|
| |||||
|
|
|
|
| Transaction Accounting Adjustments |
|
|
|
| ||||||||||||||||
|
|
| Historical |
|
| Conforming and |
|
|
|
| North Peak |
|
|
|
| Pro Forma |
| ||||||||
|
|
| PEDEVCO |
|
| North Peak |
|
| Reclassifications |
|
|
| Merger |
|
|
| Combined |
| |||||||
| Revenue: |
|
|
|
|
|
|
|
|
|
|
|
|
|
|
|
|
|
|
| |||||
| Oil and gas sales |
| $ | 22,669 |
|
| $ | — |
|
| $ | 78,744 |
|
| (a) |
| $ | — |
|
|
|
| $ | 101,413 |
|
| Crude oil, natural gas and NGL sales, net |
|
| — |
|
|
| 78,744 |
|
|
| (78,744 | )(a) |
|
|
|
| — |
|
|
|
|
| — |
|
| Gain (loss) on derivatives, net |
|
| — |
|
|
| 7,898 |
|
|
|
|
|
|
|
|
| — |
|
|
|
|
| 7,898 |
|
|
|
|
|
|
|
|
|
|
|
|
|
|
|
|
|
|
|
|
|
|
|
|
|
|
|
| Operating expenses: |
|
|
|
|
|
|
|
|
|
|
|
|
|
|
|
|
|
|
|
|
|
|
|
|
| Lease operating costs |
|
| 8,305 |
|
|
| — |
|
|
| 30,647 |
|
| (a) |
|
| — |
|
|
|
|
| 49,310 |
|
|
|
|
|
|
|
|
|
|
|
|
| 162 |
|
| (a) |
|
|
|
|
|
|
|
|
|
|
|
|
|
|
|
|
|
|
|
|
|
| 10,196 |
|
| (a) |
|
|
|
|
|
|
|
|
|
|
| Lease operating and workover expenses |
|
| — |
|
|
| 30,647 |
|
|
| (30,647 | ) |
| (a) |
|
| — |
|
|
|
|
| — |
|
| Exploration expense |
|
| — |
|
|
| 162 |
|
|
| (162 | ) |
| (a) |
|
| — |
|
|
|
|
| — |
|
| Production and ad valorem taxes |
|
| — |
|
|
| 10,196 |
|
|
| (10,196 | ) |
| (a) |
|
| — |
|
|
|
|
| — |
|
| Selling, general and administrative expense |
|
| 4,815 |
|
|
| — |
|
|
| 4,786 |
|
| (a) |
|
| — |
|
|
|
|
| 13,565 |
|
|
|
|
|
|
|
|
|
|
|
|
| 3,964 |
|
| (a) |
|
|
|
|
|
|
|
|
|
|
| General and administrative |
|
| — |
|
|
| 4,786 |
|
|
| (4,786 | ) |
| (a) |
|
| — |
|
|
|
|
| — |
|
| Impairment of oil and gas properties |
|
| 907 |
|
|
| — |
|
|
| — |
|
|
|
|
| — |
|
|
|
|
| 907 |
|
| Depletion, depreciation and amortization |
|
| — |
|
|
| 36,256 |
|
|
| — |
|
|
|
|
| (36,256 | ) |
| (b) |
|
| — |
|
| Accretion |
|
| — |
|
|
| 209 |
|
|
| — |
|
|
|
|
| (209 | ) |
| (b) |
|
| — |
|
| Affiliate expense |
|
| — |
|
|
| 3,964 |
|
|
| (3,964 | ) |
| (a) |
|
| — |
|
|
|
|
| — |
|
| Depreciation, depletion, amortization and accretion |
|
| 11,213 |
|
|
| — |
|
|
| — |
|
|
|
|
| 13,120 |
|
| (b) |
|
| 24,430 |
|
|
|
|
|
|
|
|
|
|
|
|
|
|
|
|
|
|
| 97 |
|
| (e) |
|
|
|
|
| Total operating expenses |
|
| 25,240 |
|
|
| 86,220 |
|
|
| — |
|
|
|
|
| (23,248 | ) |
|
|
|
| 88,212 |
|
|
|
|
|
|
|
|
|
|
|
|
|
|
|
|
|
|
|
|
|
|
|
|
|
|
|
| Gain on sale of oil and gas properties |
|
| 1,021 |
|
|
| — |
|
|
| (1,686 | ) |
| (a) |
|
| — |
|
|
|
|
| (665 | ) |
| Note receivable – credit loss |
|
| (1,378 | ) |
|
| — |
|
|
| — |
|
|
|
|
| — |
|
|
|
|
| (1,378 | ) |
|
|
|
|
|
|
|
|
|
|
|
|
|
|
|
|
|
|
|
|
|
|
|
|
|
|
| Operating income (loss) |
|
| (2,928 | ) |
|
| 422 |
|
|
| (1,686 | ) |
|
|
|
| 23,248 |
|
|
|
|
| 19,056 |
|
|
|
|
|
|
|
|
|
|
|
|
|
|
|
|
|
|
|
|
|
|
|
|
|
|
|
| Other income (expense), net: |
|
|
|
|
|
|
|
|
|
|
|
|
|
|
|
|
|
|
|
|
|
|
|
|
| Interest income |
|
| 196 |
|
|
| — |
|
|
| — |
|
|
|
|
| — |
|
|
|
|
| 196 |
|
| Interest expense |
|
| (102 | ) |
|
| (13,678 | ) |
|
| — |
|
|
|
|
| 8,628 |
|
| (c) |
|
| (5,152 | ) |
| Gain (loss) on the sale of assets |
|
| — |
|
|
| (1,686 | ) |
|
| 1,686 |
|
| (a) |
|
| — |
|
|
|
|
| — |
|
| Other income |
|
| 395 |
|
|
| 1,910 |
|
|
|
|
|
|
|
|
| — |
|
|
|
|
| 2,305 |
|
| Total other income (expense) |
|
| 489 |
|
|
| (13,454 | ) |
|
| 1,686 |
|
|
|
|
| 8,628 |
|
|
|
|
| (2,651 | ) |
| Income (loss) before income taxes |
|
| (2,439 | ) |
|
| (13,032 | ) |
|
| — |
|
|
|
|
| 31,875 |
|
|
|
|
| 16,404 |
|
| Income tax benefit (expense) |
|
| 578 |
|
|
| — |
|
|
| — |
|
|
|
|
| (3,957 | ) |
| (d) |
|
| (3,379 | ) |
|
|
|
|
|
|
|
|
|
|
|
|
|
|
|
|
|
|
|
|
|
|
|
|
|
|
| Net income (loss) |
| $ | (1,861 | ) |
| $ | (13,032 | ) |
| $ | — |
|
|
|
| $ | 27,918 |
|
|
|
| $ | 13,025 |
|
|
|
|
|
|
|
|
|
|
|
|
|
|
|
|
|
|
|
|
|
|
|
|
|
|
|
| Earnings (loss) per common share: |
|
|
|
|
|
|
|
|
|
|
|
|
|
|
|
|
|
|
|
|
|
|
|
|
| Basic |
| $ | (0.02 | ) |
|
|
|
|
|
|
|
|
|
|
| $ | 0.16 |
|
| (h) |
| $ | 0.14 |
|
| Diluted |
| $ | (0.02 | ) |
|
|
|
|
|
|
|
|
|
|
| $ | 0.07 |
|
| (h) |
| $ | 0.05 |
|
|
|
|
|
|
|
|
|
|
|
|
|
|
|
|
|
|
|
|
|
|
|
|
|
|
|
| Weighted average number of common shares outstanding: |
|
|
|
|
|
|
|
|
|
|
|
|
|
|
|
|
|
|
|
|
|
|
|
|
| Basic |
|
| 91,482,504 |
|
|
|
|
|
|
|
|
|
|
|
|
| — |
|
| (h) |
|
| 91,482,504 |
|
| Diluted |
|
| 91,482,504 |
|
|
|
|
|
|
|
|
|
|
|
|
| 106,500,000 |
|
| (h) |
|
| 261,618,874 |
|
|
|
|
|
|
|
|
|
|
|
|
|
|
|
|
|
|
| 63,636,370 |
|
| (g) |
|
|
|
|
The accompanying notes are an integral part of these unaudited pro forma condensed combined financial statements.
| PEDEVCO Corp. | ||||||||||||||||||||||||
| Unaudited Pro Forma Condensed Combined Statement of Operations | ||||||||||||||||||||||||
| For the Year Ended December 31, 2024 | ||||||||||||||||||||||||
| (amounts in thousands, except for share and per share amounts) | ||||||||||||||||||||||||
|
|
|
|
|
|
|
|
|
|
|
|
|
|
|
|
|
|
|
|
| |||||
|
|
|
|
| Transaction Accounting Adjustments |
|
|
|
| ||||||||||||||||
|
|
| Historical |
|
| Conforming and |
|
|
|
| North Peak |
|
|
|
| Pro Forma |
| ||||||||
|
|
| PEDEVCO |
|
| North Peak |
|
| Reclassifications |
|
|
| Merger |
|
|
| Combined |
| |||||||
| Revenue: |
|
|
|
|
|
|
|
|
|
|
|
|
|
|
|
|
|
|
| |||||
| Oil and gas sales |
| $ | 39,553 |
|
| $ | — |
|
| $ | 158,326 |
|
| (a) |
| $ | — |
|
|
|
| $ | 197,879 |
|
| Crude oil, natural gas and NGL sales, net |
|
| — |
|
|
| 158,326 |
|
|
| (158,326 | ) |
| (a) |
|
| — |
|
|
|
|
| — |
|
| Loss on derivatives, net |
|
| — |
|
|
| (5,089 | ) |
|
| — |
|
|
|
|
| — |
|
|
|
|
| (5,089 | ) |
|
|
|
|
|
|
|
|
|
|
|
|
|
|
|
|
|
|
|
|
|
|
|
|
|
|
| Operating expenses: |
|
|
|
|
|
|
|
|
|
|
|
|
|
|
|
|
|
|
|
|
|
|
|
|
| Lease operating costs |
|
| 12,449 |
|
|
| — |
|
|
| 49,096 |
|
| (a) |
|
| — |
|
|
|
|
| 82,453 |
|
|
|
|
|
|
|
|
|
|
|
|
| 152 |
|
| (a) |
|
|
|
|
|
|
|
|
|
|
|
|
|
|
|
|
|
|
|
|
|
| 20,756 |
|
| (a) |
|
|
|
|
|
|
|
|
|
|
| Lease operating and workover expenses |
|
| — |
|
|
| 49,096 |
|
|
| (49,096 | ) |
| (a) |
|
| — |
|
|
|
|
| — |
|
| Exploration expense |
|
| — |
|
|
| 152 |
|
|
| (152 | ) |
| (a) |
|
| — |
|
|
|
|
| — |
|
| Production and ad valorem taxes |
|
| — |
|
|
| 20,756 |
|
|
| (20,756 | ) |
| (a) |
|
| — |
|
|
|
|
| — |
|
| Selling, general and administrative expense |
|
| 6,391 |
|
|
| — |
|
|
| 3,488 |
|
| (a) |
|
| 4,715 |
|
| (f) |
|
| 21,969 |
|
|
|
|
|
|
|
|
|
|
|
|
| 78 |
|
| (a) |
|
|
|
|
|
|
|
|
|
|
|
|
|
|
|
|
|
|
|
|
|
| 7,297 |
|
| (a) |
|
|
|
|
|
|
|
|
|
|
| General and administrative |
|
| — |
|
|
| 3,488 |
|
|
| (3,488 | ) |
| (a) |
|
| — |
|
|
|
|
| — |
|
| Impairment of oil and gas properties |
|
| — |
|
|
| 3,894 |
|
|
| — |
|
|
|
|
| — |
|
|
|
|
| 3,894 |
|
| Legal |
|
| — |
|
|
| 78 |
|
|
| (78 | ) |
| (a) |
|
| — |
|
|
|
|
| — |
|
| Depletion, depreciation and amortization |
|
| — |
|
|
| 55,201 |
|
|
| — |
|
|
|
|
| (55,201 | ) |
| (b) |
|
| — |
|
| Accretion |
|
| — |
|
|
| 260 |
|
|
| — |
|
|
|
|
| (260 | ) |
| (b) |
|
| — |
|
| Affiliate expense |
|
| — |
|
|
| 7,297 |
|
|
| (7,297 | ) |
| (a) |
|
| — |
|
|
|
|
| — |
|
| Depreciation, depletion, amortization and accretion |
|
| 15,920 |
|
|
| — |
|
|
| — |
|
|
|
|
| 19,944 |
|
| (b) |
|
| 35,994 |
|
|
|
|
|
|
|
|
|
|
|
|
|
|
|
|
|
|
| 130 |
|
| (e) |
|
|
|
|
| Total operating expenses |
|
| 34,760 |
|
|
| 140,222 |
|
|
| — |
|
|
|
|
| (30,672 | ) |
|
|
|
| 144,310 |
|
|
|
|
|
|
|
|
|
|
|
|
|
|
|
|
|
|
|
|
|
|
|
|
|
|
|
| Loss on sale of oil and gas properties, net |
|
| (76 | ) |
|
| — |
|
|
| — |
|
|
|
|
| — |
|
|
|
|
| (76 | ) |
|
|
|
|
|
|
|
|
|
|
|
|
|
|
|
|
|
|
|
|
|
|
|
|
|
|
| Operating income |
|
| 4,717 |
|
|
| 13,015 |
|
|
| — |
|
|
|
|
| 30,672 |
|
|
|
|
| 48,404 |
|
|
|
|
|
|
|
|
|
|
|
|
|
|
|
|
|
|
|
|
|
|
|
|
|
|
|
| Other income (expense), net: |
|
|
|
|
|
|
|
|
|
|
|
|
|
|
|
|
|
|
|
|
|
|
|
|
| Interest income |
|
| 351 |
|
|
| — |
|
|
| — |
|
|
|
|
| — |
|
|
|
|
| 351 |
|
| Interest expense |
|
| — |
|
|
| (21,093 | ) |
|
| — |
|
|
|
|
| 14,359 |
|
| (c) |
|
| (6,734 | ) |
| Loss on legal judgment |
|
| — |
|
|
| (490 | ) |
|
| 490 |
|
| (a) |
|
| — |
|
|
|
|
| — |
|
| Gain on sale of fixed asset |
|
| 12 |
|
|
| — |
|
|
| — |
|
|
|
|
| — |
|
|
|
|
| 12 |
|
| Other income (expense) |
|
| (42 | ) |
|
| 4,215 |
|
|
| (490 | ) |
| (a) |
|
| — |
|
|
|
|
| 3,683 |
|
| Total other income (expense) |
|
| 321 |
|
|
| (17,368 | ) |
|
| — |
|
|
|
|
| 14,359 |
|
|
|
|
| (2,688 | ) |
| Income (loss) before income taxes |
|
| 5,038 |
|
|
| (4,353 | ) |
|
| — |
|
|
|
|
| 45,031 |
|
|
|
|
| 45,716 |
|
| Income tax benefit (expense) |
|
| 7,255 |
|
|
| — |
|
|
| — |
|
|
|
|
| (8,542 | ) |
| (d) |
|
| (1,287 | ) |
|
|
|
|
|
|
|
|
|
|
|
|
|
|
|
|
|
|
|
|
|
|
|
|
|
|
| Net income (loss) |
| $ | 12,293 |
|
| $ | (4,353 | ) |
| $ | — |
|
|
|
| $ | 36,489 |
|
|
|
| $ | 44,429 |
|
|
|
|
|
|
|
|
|
|
|
|
|
|
|
|
|
|
|
|
|
|
|
|
|
|
|
| Earnings per common share: |
|
|
|
|
|
|
|
|
|
|
|
|
|
|
|
|
|
|
|
|
|
|
|
|
| Basic |
| $ | 0.14 |
|
|
|
|
|
|
|
|
|
|
|
| $ | 0.36 |
|
| (h) |
| $ | 0.50 |
|
| Diluted |
| $ | 0.14 |
|
|
|
|
|
|
|
|
|
|
|
| $ | 0.03 |
|
| (h) |
| $ | 0.17 |
|
|
|
|
|
|
|
|
|
|
|
|
|
|
|
|
|
|
|
|
|
|
|
|
|
|
|
| Weighted average number of common shares outstanding: |
|
|
|
|
|
|
|
|
|
|
|
|
|
|
|
|
|
|
|
|
|
|
|
|
| Basic |
|
| 89,234,611 |
|
|
|
|
|
|
|
|
|
|
|
|
| — |
|
| (h) |
|
| 89,234,611 |
|
| Diluted |
|
| 89,236,237 |
|
|
|
|
|
|
|
|
|
|
|
|
| 106,500,000 |
|
| (h) |
|
| 259,372,607 |
|
|
|
|
|
|
|
|
|
|
|
|
|
|
|
|
|
|
| 63,636,370 |
|
| (g) |
|
|
|
|
The accompanying notes are an integral part of these unaudited pro forma condensed combined financial statements.
PEDEVCO Corp.
Notes to Unaudited Pro Forma Condensed Combined Financial Information
1. Basis of Presentation
The accompanying unaudited pro forma condensed combined financial information were prepared based on the historical consolidated financial statements of PEDEVCO and the historical combined financial statements of North Peak. The North Peak Merger has been accounted for as a business combination in accordance with ASC 805. PEDEVCO will recognize the assets acquired and liabilities assumed at their respective fair values as of the closing date. Any transactions cost will be expensed as incurred in accordance with ASC 805.
The Unaudited Pro Forma Condensed Combined Balance Sheet as of September 30, 2025 gives effect to the North Peak Merger as if it had been completed on September 30, 2025. The Unaudited Pro Forma Condensed Combined Statements of Operations for the Nine Months Ended September 30, 2025 and the Year Ended December 31, 2024 gives effect to the North Peak Merger as if it had been completed on January 1, 2024. These pro forma adjustments are described in more detail in the accompanying notes to the unaudited pro forma condensed combined financial information.
The unaudited pro forma condensed combined financial information is provided for illustrative purposes only and does not purport to represent what the actual consolidated results of operations or the consolidated financial position of PEDEVCO would have been had the North Peak Merger occurred on the dates noted above, nor are they indicative of future consolidated results of operations or consolidated financial position. Future results may vary significantly from the results reflected in the unaudited condensed combined pro forma statement of operations. In PEDEVCO’s opinion, all adjustments that are necessary to present fairly the unaudited pro forma condensed combined financial information have been made.
2. Consideration and Purchase Price Allocation
The preliminary allocation of the total purchase price is based upon management’s estimates of, and assumptions related to, the fair value of assets acquired and liabilities assumed as of September 30, 2025 using currently available information and market data. Because the unaudited pro forma condensed combined financial information has been prepared based on these preliminary estimates, the final purchase price allocation and the resulting effect on financial position and results of operations may differ significantly from the pro forma amounts included herein. PEDEVCO expects to finalize the purchase price allocation as soon as reasonably practicable, which will not extend beyond the one-year measurement period provided under ASC 805.
The preliminary purchase price allocation is subject to change due to several factors, including but not limited to changes in the estimated fair value of assets acquired and liabilities assumed as of the closing date of the transaction, which could result from changes in future oil and natural gas commodity prices, reserve estimates, interest rates, as well as other factors.
The consideration transferred and the fair value of assets acquired and liabilities assumed by PEDEVCO are as follows (in thousands, except for per share amounts):
| Consideration: |
|
|
| |
| Series A Convertible Preferred Stock of PEDEVCO |
|
| 10,650 |
|
| Fair value per share of Series A Convertible Preferred Stock of PEDEVCO |
| $ | 6.03 |
|
| Total stock consideration |
|
| 64,220 |
|
|
|
|
|
|
|
| Cash paid to settle North Peak debt contemporaneously with close |
|
| 115,646 |
|
|
|
|
|
|
|
| Total consideration |
| $ | 179,866 |
|
|
|
|
|
|
|
| Fair value of assets acquired: |
|
|
|
|
| Cash and cash equivalents |
| $ | 1,266 |
|
| Accounts receivable – oil and gas |
|
| 10,870 |
|
| Commodity derivative asset, current |
|
| 4,569 |
|
| Prepaid expenses and other current assets |
|
| 692 |
|
| Oil and gas properties, subject to amortization, net |
|
| 191,700 |
|
| Oil and gas properties, not subject to amortization, net |
|
| 8,393 |
|
| Commodity derivative asset, noncurrent |
|
| 1,516 |
|
| Other long-term assets |
|
| 467 |
|
| Amount attributable to assets acquired |
| $ | 219,473 |
|
|
|
|
|
|
|
| Fair value of liabilities assumed: |
|
|
|
|
| Accounts payable |
| $ | 17,268 |
|
| Accrued expenses |
|
| 3,185 |
|
| Revenue payable |
|
| 15,327 |
|
| Asset retirement obligations, current |
|
| 488 |
|
| Asset retirement obligations, long-term |
|
| 1,096 |
|
| Other long-term liabilities |
|
| 2,243 |
|
| Amount attributable to liabilities assumed |
| $ | 39,607 |
|
|
|
|
|
|
|
| Total identifiable net assets acquired |
| $ | 179,866 |
|
The fair value measurements of assets acquired and liabilities assumed are based on inputs that are not observable in the market and therefore represent Level 3 inputs. The fair value of oil and gas properties and asset retirement obligations were measured using the discounted cash flow technique of valuation. The fair value per share of Series A Convertible Preferred Stock of PEDEVCO is estimated based upon the fair value of the common stock of PEDEVCO. Each share of Series A Convertible Preferred Stock automatically converts at a ratio of 10-to-1 into PEDEVCO common stock immediately following a 20-calendar day waiting period, which commences on the distribution of PEDEVCO’s information statement. The fair value for the Series A Convertible Preferred Stock was based upon the October 31, 2025 closing price of $0.603 per common share multiplied by the conversion ratio of 10-to-1.
Significant unobservable inputs included future commodity prices adjusted for differentials, projections of estimated quantities of recoverable reserves, forecasted production based on decline curve analysis, estimated timing and amount of future operating and development costs, and a weighted average cost of capital.
3. Adjustments to Unaudited Pro Forma Condensed Combined Balance Sheet and Unaudited Pro Forma Condensed Combined Statements of Operations
The unaudited pro forma condensed combined financial information has been compiled in a manner consistent with the accounting policies adopted by PEDEVCO. Actual results may differ materially from the assumptions and estimates contained herein.
The pro forma adjustments are based on currently available information and certain estimates and assumptions that PEDEVCO believes provide a reasonable basis for presenting the significant effects of the North Peak Merger. General descriptions of the pro forma adjustments are provided below.
Unaudited Pro Forma Condensed Combined Balance Sheet
The following adjustments were made in the preparation of the Unaudited Pro Forma Condensed Combined Balance Sheet as of September 30, 2025:
|
| (a) | Adjustments to conform the assets and liabilities of North Peak to the presentation of PEDEVCO. |
|
| (b) | Adjustments to remove the historical balances of oil and natural gas properties, net and members’ equity for North Peak. |
|
| (c) | Adjustment to reflect the private placement of 6,363,637 shares of Series A Convertible Preferred Stock for $35.0 million of net proceeds. The private placement occurred concurrently with the North Peak Merger. When converted in full, the PIPE Preferred Shares will convert into 63,636,370 shares of PEDEVCO common stock. |
|
| (d) | Adjustment to reflect the fair value of oil and gas properties, subject to amortization, acquired in the North Peak Merger. The fair value of proved oil and natural gas properties, subject to amortization, was estimated using a discounted cash flow approach and strip oil and natural gas prices as of October 31, 2025. |
|
| (e) | Adjustment to reflect the fair value of oil and gas properties, not subject to amortization, acquired in the North Peak Merger. The fair value of oil and gas properties, not subject to amortization, was estimated based upon acreage value from observable transactions for these areas. |
|
| (f) | Adjustment to reflect the fair value of asset retirement obligations assumed with the North Peak Merger. The fair value of asset retirement obligations was estimated using assumptions consistent with those of PEDEVCO, including a credit-adjusted risk-free rate of 11.00%, an inflation rate of 2.6%, a 33 year well life and a reclamation cost of $0.1 million per well. |
|
| (g) | Adjustment to reflect the issuance of 10,650,000 shares of Convertible Series A Preferred Stock for $64.2 million based on an October 31, 2025 fair value of $6.03 per share. |
|
| (h) | Adjustment to record borrowings of $87.0 million under the PEDEVCO's revolving credit facility to fund a portion of the North Peak Merger. Additionally, PEDEVCO paid $1.3 million of debt issuance costs associated with an amendment to the existing revolving credit facility which is included in “Other assets.” |
|
| (i) | Adjustment to repay the outstanding debt of North Peak of $115.7 million, which was funded by PEDEVCO drawing down on its revolving line of credit and through the issuance of $35.0 million of Series A Convertible Preferred Stock. |
|
| (j) | Adjustment to reflect estimated direct costs for the North Peak Merger. The estimated direct costs were incurred subsequent to September 30, 2025 and have been retrospectively reflected as though incurred and paid at September 30, 2025. These direct costs are nonrecurring and will not impact PEDEVCO’s Consolidated Statements of Operations beyond 12 months after closing. |
|
| (k) | Represents the tax effect associated with the adjustment for the recognition of the North Peak Merger transaction costs. The tax effect was calculated at the statutory tax rate of 21.0%. The actual future effective tax rate could be significantly different from the statutory tax rate due to many factors, such as future results and future tax attributes. |
|
| (l) | Adjustment to record the difference between the outstanding debt balance of North Peak at September 30, 2025 and the ultimate pay-off of such debt by PEDEVCO at October 31, 2025. |
Unaudited Pro Forma Condensed Combined Statements of Operations
The following adjustments were made in the preparation of the Unaudited Pro Forma Condensed Combined Statements of Operations for the nine months ended September 30, 2025 and the year ended December 31, 2024:
|
| (a) | Adjustments to conform North Peak revenues and expenses to the presentation by PEDEVCO. |
|
| (b) | Represents the removal of depreciation, depletion, and amortization expense and accretion expense of North Peak and the resulting change in basis of oil and gas properties acquired as a result of the North Peak Merger. The depletion expense adjustment was calculated using the unit-of-production method under the successful efforts method of accounting using estimated proved reserves and production volumes attributable to the acquired assets. |
|
| (c) | Adjustment to reflect the estimated interest expense in the period with respect to borrowings by PEDEVCO to effectuate the North Peak Merger. The interest rate utilized as of September 30, 2025 was approximately 7.7% per annum for incremental borrowings of PEDEVCO. A one-eighth point change in interest rates as of September 30, 2025 would change interest expense by $0.1 million for the nine months ended September 30, 2025 and the year ended December 31, 2024. |
|
| (d) | Adjustment to reflect estimated income taxes associated with the North Peak Merger. Income taxes were estimated by applying the statutory rate of 21.0% to pre-tax income of the operations of North Peak and to the transaction accounting adjustments. The actual future effective tax rate could be significantly different from the statutory tax rate due to many factors, such as future results and future tax attributes. |
|
| (e) | Represents accretion expense from new asset retirement obligations recognized as a result of the North Peak Merger. The accretion adjustment was estimated using assumptions consistent with those of PEDEVCO, including a credit-adjusted risk-free rate of 11.00%, an inflation rate of 2.6%, a 33 year well life and a reclamation cost of $0.1 million per well. |
|
| (f) | Adjustment to reflect estimated direct costs for the North Peak Merger. The estimated direct costs were incurred subsequent to September 30, 2025 and have been retrospectively reflected as though incurred for the year ended December 31, 2024. These direct costs are nonrecurring and will not impact PEDEVCO’s Consolidated Statements of Operations beyond 12 months after closing. |
|
| (g) | Concurrently with the Closing Date of the North Peak Merger, certain investors subscribed for and purchased an aggregate of 6,363,637 PIPE Preferred Shares for net proceeds of $35.0 million. The PIPE Preferred Shares automatically convert at a ratio of 10-to-1 into PEDEVCO common stock immediately following a 20-calendar day waiting period, which commences on the distribution of PEDEVCO’s information statement. When converted in full, the PIPE Preferred Shares will convert into 63,636,370 shares of PEDEVCO common stock. |
|
| (h) | The following table reconciles historical and pro forma basic and diluted earnings (loss) per share for the periods indicated (in thousands, except for share and per share amounts): |
|
|
| For the Nine Months Ended September 30, 2025 |
|
| For the Year Ended December 31, 2024 |
| ||||||||||
|
|
| Historical |
|
| Pro Forma |
|
| Historical |
|
| Pro Forma |
| ||||
| Numerator: |
|
|
|
|
|
|
|
|
|
|
|
| ||||
| Net income (loss) |
| $ | (1,861 | ) |
| $ | 13,025 |
|
| $ | 12,293 |
|
| $ | 44,429 |
|
|
|
|
|
|
|
|
|
|
|
|
|
|
|
|
|
|
|
| Denominator: |
|
|
|
|
|
|
|
|
|
|
|
|
|
|
|
|
| Weighted average common shares — basic |
|
| 91,482,504 |
|
|
| 91,482,504 |
|
|
| 89,234,611 |
|
|
| 89,234,611 |
|
|
|
|
|
|
|
|
|
|
|
|
|
|
|
|
|
|
|
| Dilutive effect of common stock equivalents: |
|
|
|
|
|
|
|
|
|
|
|
|
|
|
|
|
| Options |
|
| — |
|
|
| — |
|
|
| 1,626 |
|
|
| 1,626 |
|
| Convertible Series A Preferred Stock |
|
| — |
|
|
| 106,500,000 |
|
|
| — |
|
|
| 106,500,000 |
|
| PIPE Preferred Shares |
|
| — |
|
|
| 63,636,370 |
|
|
| — |
|
|
| 63,636,370 |
|
|
|
|
|
|
|
|
|
|
|
|
|
|
|
|
|
|
|
| Denominator: |
|
|
|
|
|
|
|
|
|
|
|
|
|
|
|
|
| Weighted average common shares — diluted |
|
| 91,482,504 |
|
|
| 261,618,874 |
|
|
| 89,236,237 |
|
|
| 259,372,607 |
|
|
|
|
|
|
|
|
|
|
|
|
|
|
|
|
|
|
|
| Earnings (loss) per share — basic |
| $ | (0.02 | ) |
| $ | 0.14 |
|
| $ | 0.14 |
|
| $ | 0.50 |
|
| Earnings (loss) per share — diluted |
| $ | (0.02 | ) |
| $ | 0.05 |
|
| $ | 0.14 |
|
| $ | 0.17 |
|
SUPPLEMENTAL UNAUDITED PRO FORMA COMBINED OIL AND GAS RESERVES AND STANDARDIZED MEASURE INFORMATION
The following tables set forth information with respect to the historical and pro forma combined estimated crude oil, natural gas and natural gas liquids reserves as of December 31, 2024 for PEDEVCO and North Peak. The pro forma combined reserves, production and standardized measure have been prepared in accordance with FASB ASC Topic 932 – Extractive Activities – Oil and Gas. The reserve information of PEDEVCO has been prepared by Cawley, Gillespie & Associates, Inc, independent petroleum engineers. North Peak reserve information has been prepared by DeGloyer and MacNaughton, independent petroleum engineers.
The following unaudited pro forma combined proved reserve information is not necessarily indicative of the results that might have occurred had the acquisition of the North Peak taken place on January 1, 2024, nor is it intended to be a projection of future results. The accuracy of any reserve estimate is a function of the quality of available data and of engineering and geological interpretation and judgment. Periodic revisions or removals of estimated reserves and future cash flows may be necessary as a result of a number of factors, including reservoir performance, new drilling, crude oil, natural gas liquids and natural gas prices, changes in costs, technological advances, new geological or geophysical data, changes in business strategies, or other economic factors. Accordingly, proved reserve estimates may differ significantly from the quantities of crude oil and natural gas ultimately recovered. For PEDEVCO and North Peak, the reserve estimates shown below were determined using the average first day of the month price for each of the preceding 12 months for crude oil, natural gas and natural gas liquids for the year ended December 31, 2024.
The reserve estimates presented below were derived from the historical reserve information of PEDEVCO and North Peak as of and for the year ended December 31, 2024. Upon completion of the North Peak Merger, the combined company will undertake a process to re-evaluate these reserves. Future development timing, development expenditures, operating costs, reservoir performance as well as commodity prices will affect the reserve volumes attributable to the combined company. The results of such reevaluation will likely result in material revisions to total proved developed and undeveloped reserves.
|
|
| For the Year Ended December 31, 2024 |
| |||||||||
|
|
| PEDEVCO Historical (2) |
|
| North Peak Historical (2) |
|
| Pro Forma Combined (2) |
| |||
| Crude Oil (MBbls) |
|
|
|
|
|
|
|
|
| |||
| Net proved reserves at December 31, 2023 |
|
| 11,358 |
|
|
| 74,718 |
|
|
| 86,076 |
|
| Revisions of previous estimates |
|
| (2,755 | ) |
|
| (37,252 | ) |
|
| (40,007 | ) |
| Revisions due to prices |
|
| (29 | ) |
|
| — |
|
|
| (29 | ) |
| Purchases in place |
|
| 471 |
|
|
| — |
|
|
| 471 |
|
| Extensions, discoveries and other additions |
|
| 2,241 |
|
|
| 1,032 |
|
|
| 3,273 |
|
| Sales in place |
|
| (54 | ) |
|
| — |
|
|
| (54 | ) |
| Production |
|
| (439 | ) |
|
| (2,145 | ) |
|
| (2,584 | ) |
| Net proved reserves at December 31, 2024 |
|
| 10,793 |
|
|
| 36,353 |
|
|
| 47,146 |
|
| Natural Gas (Mmcf) |
|
|
|
|
|
|
|
|
|
|
|
|
| Net proved reserves at December 31, 2023 |
|
| 19,885 |
|
|
| 149,324 |
|
|
| 169,209 |
|
| Revisions of previous estimates |
|
| (2,433 | ) |
|
| (105,080 | ) |
|
| (107,513 | ) |
| Revisions due to prices |
|
| (43 | ) |
|
| — |
|
|
| (43 | ) |
| Purchases in place |
|
| 1,728 |
|
|
| — |
|
|
| 1,728 |
|
| Extensions, discoveries and other additions |
|
| 4,939 |
|
|
| 598 |
|
|
| 5,537 |
|
| Sales in place |
|
| (154 | ) |
|
| — |
|
|
| (154 | ) |
| Production |
|
| (506 | ) |
|
| (1,534 | ) |
|
| (2,040 | ) |
| Net proved reserves at December 31, 2024 |
|
| 23,416 |
|
|
| 43,308 |
|
|
| 66,724 |
|
| NGL (MBbbls) |
|
|
|
|
|
|
|
|
|
|
|
|
| Net proved reserves at December 31, 2023 |
|
| 2,374 |
|
|
| 18,110 |
|
|
| 20,484 |
|
| Revisions of previous estimates |
|
| 172 |
|
|
| (11,514 | ) |
|
| (11,342 | ) |
| Revisions due to prices |
|
| (3 | ) |
|
| — |
|
|
| (3 | ) |
| Purchases in place |
|
| 253 |
|
|
| — |
|
|
| 253 |
|
| Extensions, discoveries and other additions |
|
| 732 |
|
|
| 128 |
|
|
| 860 |
|
| Sales in place |
|
| (19 | ) |
|
| — |
|
|
| (19 | ) |
| Production |
|
| (62 | ) |
|
| (234 | ) |
|
| (296 | ) |
| Net proved reserves at December 31, 2024 |
|
| 3,447 |
|
|
| 6,490 |
|
|
| 9,937 |
|
| Oil Equivalents (Mboe) (1) |
|
|
|
|
|
|
|
|
|
|
|
|
| Net proved reserves at December 31, 2023 |
|
| 17,046 |
|
|
| 117,715 |
|
|
| 134,761 |
|
| Revisions of previous estimates |
|
| (2,989 | ) |
|
| (66,279 | ) |
|
| (69,268 | ) |
| Revisions due to prices |
|
| (39 | ) |
|
| — |
|
|
| (39 | ) |
| Purchases in place |
|
| 1,012 |
|
|
| — |
|
|
| 1,012 |
|
| Extensions, discoveries and other additions |
|
| 3,796 |
|
|
| 1,260 |
|
|
| 5,056 |
|
| Sales in place |
|
| (99 | ) |
|
| — |
|
|
| (99 | ) |
| Production |
|
| (585 | ) |
|
| (2,635 | ) |
|
| (3,220 | ) |
| Net proved reserves at December 31, 2024 |
|
| 18,142 |
|
|
| 50,061 |
|
|
| 68,203 |
|
(1) Assumes a ratio of 1 barrel of oil per 6 Mcfe.
(2) Amounts and totals shown are rounded and therefore may not sum precisely.
|
|
| As of December 31, 2024 |
| |||||||||
| Proved Developed Reserves |
| PEDEVCO Historical (2) |
|
| North Peak Historical (2) |
|
| Pro Forma Combined (2) |
| |||
| Crude Oil (MBbls) |
|
| 2,443 |
|
|
| 14,049 |
|
|
| 16,492 |
|
| Natural Gas (Mmcf) |
|
| 4,292 |
|
|
| 10,905 |
|
|
| 15,197 |
|
| NGL (MBbls) |
|
| 630 |
|
|
| 1,980 |
|
|
| 2,610 |
|
| Oil Equivalents (MMBoe) (1) |
|
| 3,788 |
|
|
| 17,846 |
|
|
| 21,634 |
|
|
|
|
|
|
|
|
|
|
|
|
|
|
|
| Proved Developed Non-Producing Reserves |
|
|
|
|
|
|
|
|
|
|
|
|
| Crude Oil (MBbls) |
|
| 13 |
|
|
| — |
|
|
| 13 |
|
| Natural Gas (Mmcf) |
|
| 44 |
|
|
| — |
|
|
| 44 |
|
| NGL (MBbls) |
|
| 7 |
|
|
| — |
|
|
| 7 |
|
| Oil Equivalents (MMBoe) (1) |
|
| 27 |
|
|
| — |
|
|
| 27 |
|
|
|
|
|
|
|
|
|
|
|
|
|
|
|
| Proved Undeveloped Reserves |
|
|
|
|
|
|
|
|
|
|
|
|
| Crude Oil (MBbls) |
|
| 8,337 |
|
|
| 22,305 |
|
|
| 30,642 |
|
| Natural Gas (Mmcf) |
|
| 19,079 |
|
|
| 32,404 |
|
|
| 51,483 |
|
| NGL (MBbls) |
|
| 2,809 |
|
|
| 4,510 |
|
|
| 7,319 |
|
| Oil Equivalents (MMBoe) (1) |
|
| 14,327 |
|
|
| 32,215 |
|
|
| 46,542 |
|
|
|
|
|
|
|
|
|
|
|
|
|
|
|
| Proved Reserves |
|
|
|
|
|
|
|
|
|
|
|
|
| Crude Oil (MBbls) |
|
| 10,793 |
|
|
| 36,353 |
|
|
| 47,146 |
|
| Natural Gas (Mmcf) |
|
| 23,415 |
|
|
| 43,308 |
|
|
| 66,723 |
|
| NGL (MBbls) |
|
| 3,446 |
|
|
| 6,490 |
|
|
| 9,936 |
|
| Oil Equivalents (MMBoe) (1) |
|
| 18,142 |
|
|
| 50,061 |
|
|
| 68,203 |
|
|
|
| As of December 31, 2023 |
| |||||||||
| Proved Developed Reserves |
| PEDEVCO Historical (2) |
|
| North Peak Historical (2) |
|
| Pro Forma Combined (2) |
| |||
| Crude Oil (MBbls) |
|
| 1,869 |
|
|
| 13,709 |
|
|
| 15,578 |
|
| Natural Gas (Mmcf) |
|
| 2,998 |
|
|
| 10,054 |
|
|
| 13,052 |
|
| NGL (MBbls) |
|
| 255 |
|
|
| 1,684 |
|
|
| 1,939 |
|
| Oil Equivalents (MMBoe) (1) |
|
| 2,624 |
|
|
| 17,069 |
|
|
| 19,692 |
|
|
|
|
|
|
|
|
|
|
|
|
|
|
|
| Proved Developed Non-Producing Reserves |
|
|
|
|
|
|
|
|
|
|
|
|
| Crude Oil (MBbls) |
|
| 702 |
|
|
| — |
|
|
| 702 |
|
| Natural Gas (Mmcf) |
|
| 1,229 |
|
|
| — |
|
|
| 1,229 |
|
| NGL (MBbls) |
|
| 144 |
|
|
| — |
|
|
| 144 |
|
| Oil Equivalents (MMBoe) (1) |
|
| 1,051 |
|
|
| — |
|
|
| 1,051 |
|
|
|
|
|
|
|
|
|
|
|
|
|
|
|
| Proved Undeveloped Reserves |
|
|
|
|
|
|
|
|
|
|
|
|
| Crude Oil (MBbls) |
|
| 8,787 |
|
|
| 61,009 |
|
|
| 69,796 |
|
| Natural Gas (Mmcf) |
|
| 15,659 |
|
|
| 139,270 |
|
|
| 154,929 |
|
| NGL (MBbls) |
|
| 1,975 |
|
|
| 16,425 |
|
|
| 18,400 |
|
| Oil Equivalents (MMBoe) (1) |
|
| 13,372 |
|
|
| 100,646 |
|
|
| 114,018 |
|
|
|
|
|
|
|
|
|
|
|
|
|
|
|
| Proved Reserves |
|
|
|
|
|
|
|
|
|
|
|
|
| Crude Oil (MBbls) |
|
| 11,358 |
|
|
| 74,718 |
|
|
| 86,076 |
|
| Natural Gas (Mmcf) |
|
| 19,886 |
|
|
| 149,324 |
|
|
| 169,209 |
|
| NGL (MBbls) |
|
| 2,374 |
|
|
| 18,110 |
|
|
| 20,484 |
|
| Oil Equivalents (MMBoe) (1) |
|
| 17,046 |
|
|
| 117,715 |
|
|
| 134,761 |
|
(1) Assumes a ratio of 1 barrel of oil per 6 Mcfe.
(2) Amounts and totals shown are rounded and therefore may not sum precisely.
The following table presents the Standardized Measure of Discounted Future Net Cash Flows (as defined by FASB Accounting Standards Codification 932) relating to the proved crude oil, natural gas and natural gas liquids reserves of PEDEVCO and of North Peak on a pro forma combined basis as of December 31, 2024. The Pro Forma Combined Standardized Measure shown below represents estimates only and should not be construed as the market value of either PEDEVCO’s crude oil, natural gas and natural gas liquids reserves or the crude oil, natural gas and natural gas liquids reserves attributable to the North Peak (in thousands):
|
|
| As of December 31, 2024 |
| |||||||||||||
|
|
| PEDEVCO Historical |
|
| North Peak Historical |
|
| Transaction Adjustment (1) |
|
| Pro Forma Combined |
| ||||
| Oil and Gas Producing Activities: |
|
|
|
|
|
|
|
|
|
|
|
| ||||
| Future cash inflows |
| $ | 916,105 |
|
| $ | 2,916,634 |
|
| $ | — |
|
| $ | 3,832,739 |
|
| Future production costs |
|
| (288,879 | ) |
|
| (1,213,282 | ) |
|
| — |
|
|
| (1,502,161 | ) |
| Future development costs |
|
| (209,139 | ) |
|
| (425,523 | ) |
|
| — |
|
|
| (634,662 | ) |
| Future income tax expense |
|
| (100,484 | ) |
|
| — |
|
|
| (230,544 | )(a) |
|
| (331,028 | ) |
| Future net cash flows |
|
| 317,603 |
|
|
| 1,277,829 |
|
|
| (230,544 | ) |
|
| 1,364,888 |
|
| 10% annual discount factor |
|
| (173,440 | ) |
|
| (664,906 | ) |
|
| 114,989 | (a) |
|
| (723,357 | ) |
| Standardized measure of discounted future net cash flows |
| $ | 144,163 |
|
| $ | 612,923 |
|
| $ | (115,555 | ) |
| $ | 641,531 |
|
| (a) | Transaction adjustments represent the estimated effect of income taxes on the undiscounted and discounted future net cash flows associated with North Peak. |
The following table sets forth the changes in the Standardized Measure of discounted future net cash flows attributable to estimated net proved crude oil, natural gas and natural gas liquids reserves of PEDEVCO and North Peak on a pro forma combined basis for the year ending December 31, 2024 (in thousands):
|
|
| For the Year Ended December 31, 2024 |
| |||||||||||||
|
|
| PEDEVCO Historical |
|
| North Peak Historical |
|
| Transaction Adjustments(1) |
|
| Pro Forma Combined |
| ||||
| Standardized measure, beginning of year |
| $ | 190,361 |
|
| $ | 1,031,057 |
|
| $ | (194,387 | )(a) |
| $ | 1,027,031 |
|
| Crude oil and natural gas sales, net of production costs |
|
| (24,653 | ) |
|
| (92,176 | ) |
|
| — |
|
|
| (116,829 | ) |
| Net changes in prices and production costs |
|
| (32,032 | ) |
|
| 55,167 |
|
|
| — |
|
|
| 23,135 |
|
| Extensions, discoveries, additions and improved recovery |
|
| — |
|
|
| 13,090 |
|
|
| — |
|
|
| 13,090 |
|
| Changes in estimated future development costs |
|
| (740 | ) |
|
| 64,005 |
|
|
| — |
|
|
| 63,265 |
|
| Development costs incurred |
|
| — |
|
|
| 49,837 |
|
|
| — |
|
|
| 49,837 |
|
| Revisions of previous quantity estimates |
|
| (40,363 | ) |
|
| (477,557 | ) |
|
| — |
|
|
| (517,920 | ) |
| Accretion of discount |
|
| (1,173 | ) |
|
| 103,106 |
|
|
| 19,439 | (a) |
|
| 121,372 |
|
| Net change in income taxes |
|
| 6,629 |
|
|
| — |
|
|
| 59,393 | (a) |
|
| 66,022 |
|
| Purchases of reserves in place |
|
| 47,162 |
|
|
| — |
|
|
| — |
|
|
| 47,162 |
|
| Sale of reserves in place |
|
| (1,028 | ) |
|
| — |
|
|
| — |
|
|
| (1,028 | ) |
| Change in timing of estimated future production |
|
| — |
|
|
| (133,606 | ) |
|
| — |
|
|
| (133,606 | ) |
| Standardized measure, end of year |
| $ | 144,163 |
|
| $ | 612,923 |
|
| $ | (115,555 | )(a) |
| $ | 641,531 |
|
| (a) | Transaction adjustments represent the estimated effect of income taxes on the undiscounted and discounted future net cash flows associated with North Peak. |